Brasil só deve dominar Leitura em 260 anos, aponta estudo do Banco Mundial Relatorio Banco Mundial _Learning

Create successful ePaper yourself
Turn your PDF publications into a flip-book with our unique Google optimized e-Paper software.
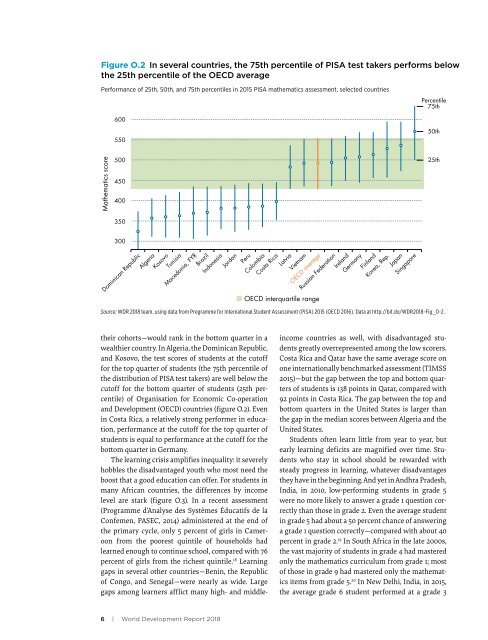
Figure O.2 In several countries, the 75th percentile of PISA test takers performs below<br />
the 25th percentile of the OECD average<br />
Performance of 25th, 50th, and 75th percentiles in 2015 PISA math<strong>em</strong>atics assessment, selected countries<br />
Percentile<br />
75th<br />
600<br />
550<br />
50th<br />
Math<strong>em</strong>atics score<br />
500<br />
450<br />
400<br />
350<br />
300<br />
Dominican Republic<br />
Algeria<br />
Kosovo<br />
Tunisia<br />
Mace<strong>do</strong>nia, FYR<br />
Brazil<br />
In<strong>do</strong>nesia<br />
Jordan<br />
Peru<br />
Colombia<br />
Source: WDR 2018 team, using data from Programme for International Student Assessment (PISA) 2015 (OECD 2016). Data at http://bit.<strong>do</strong>/WDR2018-Fig_O-2.<br />
their cohorts—would rank in the bottom quarter in a<br />
wealthier country. In Algeria, the Dominican Republic,<br />
and Kosovo, the test scores of students at the cutoff<br />
for the top quarter of students (the 75th percentile of<br />
the distribution of PISA test takers) are well below the<br />
cutoff for the bottom quarter of students (25th percentile)<br />
of Organisation for Economic Co-operation<br />
and Development (OECD) countries (figure O.2). Even<br />
in Costa Rica, a relatively strong performer in education,<br />
performance at the cutoff for the top quarter of<br />
students is equal to performance at the cutoff for the<br />
bottom quarter in Germany.<br />
The learning crisis amplifies inequality: it severely<br />
hobbles the disadvantaged youth who most need the<br />
boost that a good education can offer. For students in<br />
many African countries, the differences by income<br />
level are stark (figure O.3). In a recent assessment<br />
(Programme d’Analyse des Systèmes Éducatifs de la<br />
Conf<strong>em</strong>en, PASEC, 2014) administered at the end of<br />
the primary cycle, only 5 percent of girls in Cameroon<br />
from the poorest quintile of households had<br />
learned enough to continue school, compared with 76<br />
percent of girls from the richest quintile. 18 <strong>Learning</strong><br />
gaps in several other countries—Benin, the Republic<br />
of Congo, and Senegal—were nearly as wide. Large<br />
gaps among learners afflict many high- and middle-<br />
Costa Rica<br />
Latvia<br />
Vietnam<br />
OECD average<br />
OECD interquartile range<br />
Russian Federation<br />
Ireland<br />
Germany<br />
Finland<br />
Korea, Rep.<br />
Japan<br />
Singapore<br />
25th<br />
income countries as well, with disadvantaged students<br />
greatly overrepresented among the low scorers.<br />
Costa Rica and Qatar have the same average score on<br />
one internationally benchmarked assessment (TIMSS<br />
2015)—but the gap between the top and bottom quarters<br />
of students is 138 points in Qatar, compared with<br />
92 points in Costa Rica. The gap between the top and<br />
bottom quarters in the United States is larger than<br />
the gap in the median scores between Algeria and the<br />
United States.<br />
Students often learn little from year to year, but<br />
early learning deficits are magnified over time. Students<br />
who stay in school should be rewarded with<br />
steady progress in learning, whatever disadvantages<br />
they have in the beginning. And yet in Andhra Pradesh,<br />
India, in 2010, low-performing students in grade 5<br />
were no more likely to answer a grade 1 question correctly<br />
than those in grade 2. Even the average student<br />
in grade 5 had about a 50 percent chance of answering<br />
a grade 1 question correctly—compared with about 40<br />
percent in grade 2. 19 In South Africa in the late 2000s,<br />
the vast majority of students in grade 4 had mastered<br />
only the math<strong>em</strong>atics curriculum from grade 1; most<br />
of those in grade 9 had mastered only the math<strong>em</strong>atics<br />
it<strong>em</strong>s from grade 5. 20 In New Delhi, India, in 2015,<br />
the average grade 6 student performed at a grade 3<br />
6 | World Development Report 2018