- Page 1 and 2:
AUST: 1300 WELDER (935 337) NZ: 080
- Page 3:
WELDING EQUIPMENT GAS EQUIPMENT IND
- Page 6 and 7:
ACCESSORIES 1 ELECTRODE HOLDERS TWI
- Page 8 and 9:
ACCESSORIES 1 LENCO® GROUND CLAMPS
- Page 10 and 11:
ACCESSORIES 1 WORK CLAMPS SPRING LO
- Page 12 and 13:
1 ACCESSORIES COOL ARC® 20 Item Nu
- Page 14 and 15:
ACCESSORIES 1 WELDING EQUIPMENT PRO
- Page 16 and 17:
1 ACCESSORIES L.I.T. PROCESS A safe
- Page 18 and 19:
ACCESSORIES 1 TIG CHAMP BRUSH DC PL
- Page 20 and 21:
1 ACCESSORIES CERAMIC BACKING BAR C
- Page 22 and 23:
1 ACCESSORIES TIP CLEANERS Part No.
- Page 24 and 25:
1 ACCESSORIES HAND TOOLS 330-B SMAL
- Page 26 and 27:
1 WELDING EQUIPMENT ACCESSORIES ARC
- Page 28 and 29:
1 ACCESSORIES K112 & K113 SUB ARC G
- Page 30 and 31:
ACCESSORIES 1 ARC GOUGING TORCHES P
- Page 32 and 33:
ACCESSORIES 1 K231 SUB ARC ASSEMBLY
- Page 34 and 35:
ACCESSORIES 1 CONTOUR® & CURV O MA
- Page 36 and 37:
1 ACCESSORIES SUMNER ULTRA CLAMPS -
- Page 38 and 39:
ACCESSORIES 1 SINGLE JACKSCREW CHAI
- Page 40 and 41:
1 ACCESSORIES RIM CLAMPS WARNINGS:
- Page 42 and 43:
ACCESSORIES 1 SADDLE MACHINE Depend
- Page 44 and 45:
ACCESSORIES 1 MONARCH BAND PIPE CUT
- Page 46 and 47:
1 ACCESSORIES PIPE WRAP The Mathey
- Page 48 and 49:
ACCESSORIES TRI TOOL INC. 1 PIPE BE
- Page 50 and 51:
ACCESSORIES TRI TOOL INC. 1 1” TO
- Page 52 and 53:
ACCESSORIES TRI TOOL INC. 1 TRI TOO
- Page 54 and 55:
ACCESSORIES 1 ARDROX 907PB ARDROX 9
- Page 56 and 57:
MMAW (STICK) WELDERS EURO No4 415V
- Page 58 and 59:
20 3.6 No MMAW (STICK) WELDERS 20 2
- Page 60 and 61:
415V AUX 5kVA 240V AUX 4kVA CUT 16m
- Page 62 and 63:
1 STICK WELDERS INVERTEC® K12040-2
- Page 64 and 65:
1 STICK WELDERS Minarc Evo 150 & 14
- Page 66 and 67:
20 3.6 TIG WELDERS 20 3.6 20 3.6 20
- Page 68 and 69:
TIG WELDERS 20 3.6 20 3.6 20 3.6 1
- Page 70 and 71:
1 TIG WELDERS INVERTEC® V160-TP K1
- Page 72 and 73:
1 TIG WELDERS INVERTEC® V270-T AC/
- Page 74 and 75:
TIG WELDERS 1 Mastertig MLS TM 3000
- Page 76 and 77:
TIG WELDERS 1 MASTERTIG MLS 3000 AC
- Page 78 and 79:
TIG TORCHES AND SPARES 1 TM9 CONSUM
- Page 80 and 81:
TIG TORCHES AND SPARES 1 TM18 CONSU
- Page 82 and 83:
TIG TORCHES AND SPARES 1 TM24 CONSU
- Page 84 and 85:
TIG TORCHES AND SPARES 1 TIGMASTER
- Page 86 and 87:
TIG TORCHES AND SPARES 1 TIG WELDIN
- Page 88 and 89:
TIG TORCHES AND SPARES 1 TTC TIG-TO
- Page 90 and 91:
1 TIG TORCHES AND SPARES TUNGSTEN E
- Page 92 and 93:
1 MIG WELDERS WeldSkill 250 MIG Por
- Page 94 and 95:
20 3.6 MIG WELDERS 20 3.6 20 3.6 1
- Page 96 and 97:
20 3.6 MIG WELDERS 20 20 3.6 3.6 1
- Page 98 and 99:
MIG WELDERS 1 SYNERGIC PULSE Intell
- Page 100 and 101:
MIG WELDERS 20 3.6 20 3.6 20 3.6 1
- Page 102 and 103:
1 MIG WELDERS CV425 - CV510 Shown w
- Page 104 and 105:
MIG WELDERS 1 KEMPACT RA 181A, 251R
- Page 106 and 107:
MIG WELDERS 1 FASTMIG PULSE 350/450
- Page 108 and 109:
1 MIG WELDERS MAGTRAC F 61 Kemppi
- Page 110 and 111:
1 Wire guide tube Wire ø mm 0.6 0.
- Page 112 and 113:
MIG WELDERS 1 Weldmatic 190 Part No
- Page 114 and 115:
MIG TORCHES AND SPARES 1 WELDING EQ
- Page 116 and 117:
MIG TORCHES AND SPARES 1 TWECO® No
- Page 118 and 119:
MIG TORCHES AND SPARES 1 SPARE PART
- Page 120 and 121:
MIG TORCHES AND SPARES 1 CONTACT TI
- Page 122 and 123:
MIG TORCHES AND SPARES 1 TWECO® NO
- Page 124 and 125:
MIG TORCHES AND SPARES 1 MIG GUN LI
- Page 126 and 127:
MIG TORCHES AND SPARES 1 1150 SELF
- Page 128 and 129:
MIG TORCHES AND SPARES 1 PROFAX HEA
- Page 130 and 131:
MIG TORCHES AND SPARES 1 130GL SELF
- Page 132 and 133:
MIG TORCHES AND SPARES 1 PROFAX® R
- Page 134 and 135:
MIG TORCHES AND SPARES 1 CONSUMABLE
- Page 136 and 137:
MIG TORCHES AND SPARES 1 CONSUMABLE
- Page 138 and 139:
MIG TORCHES AND SPARES 1 CONSUMABLE
- Page 140 and 141:
MIG TORCHES AND SPARES 1 MIG/MAG WE
- Page 142 and 143:
MIG TORCHES AND SPARES 1 MIG/MAG WE
- Page 144 and 145:
MIG TORCHES AND SPARES 1 BERNARD MI
- Page 146 and 147:
MIG TORCHES AND SPARES 1 LINERS WIR
- Page 148 and 149:
MULTI-PROCESS WELDERS 20 3.6 20 3.6
- Page 150 and 151:
20 3.6 MULTI-PROCESS WELDERS 20 3.6
- Page 152 and 153:
20 3.6 MULTI-PROCESS WELDERS 20 20
- Page 154 and 155:
1 WELDING EQUIPMENT MULTI-PROCESS W
- Page 156 and 157:
MULTI-PROCESS WELDERS 20 3.6 20 3.6
- Page 158 and 159:
ENGINE DRIVEN WELDERS 20 3.6 1 OUTB
- Page 160 and 161:
ENGINE DRIVEN WELDERS 20 3.6 1 Vant
- Page 162 and 163:
1 WIRE FEEDERS TRANSMIG VA4000 Part
- Page 164 and 165:
WIRE FEEDERS 1 LF-72 and LF-74 Wire
- Page 166 and 167:
1 WIRE FEEDERS LN-25 PRO K2614-1 K2
- Page 168 and 169:
PLASMA 1 CUTSKILL 35A PLASMA INVERT
- Page 170 and 171:
1 WELDING EQUIPMENT PLASMA CUTMASTE
- Page 172 and 173:
PLASMA TORCHES AND SPARES 1 HAND TO
- Page 174 and 175:
PLASMA TORCHES AND SPARES 1 PLASMA
- Page 176 and 177:
PLASMA TORCHES AND SPARES 1 PCH/M-8
- Page 178 and 179:
PLASMA TORCHES AND SPARES 1 PCT 20
- Page 180 and 181:
PLASMA TORCHES AND SPARES 1 T100 TO
- Page 182 and 183:
PLASMA TORCHES AND SPARES 1 PT-25 P
- Page 184 and 185:
PLASMA TORCHES AND SPARES 1 PLASMA
- Page 186 and 187:
PURGING 1 ARGWELD INFLATABLE PIPE P
- Page 188 and 189:
PURGING 1 ARGWELD PIPE PURGE PLUGS
- Page 190 and 191:
PORTABLE OVENS 1 INDUSTRIAL WELDING
- Page 192 and 193:
SPECIALISED WELDERS 1 ROBOTS Purcha
- Page 194 and 195:
1 AUTOMATION BOA-408i S4 package Th
- Page 196 and 197:
AUTOMATION 1 TOOL POSITIONING SYSTE
- Page 198 and 199:
1 AUTOMATION SPEED WEAVER II The Sp
- Page 200 and 201:
AUTOMATION 1 BUG-GY FILLET WELDER A
- Page 202 and 203:
AUTOMATION 1 BENT RIGID RAILS (BRR)
- Page 204 and 205:
AUTOMATION 1 WELDING CHUCK Bigger w
- Page 206 and 207:
1 AUTOMATION VRX INTERNAL VRD The i
- Page 208 and 209:
AUTOMATION 1 FLUX RECOVERY MADE EA$
- Page 210 and 211:
AUTOMATION 1 SPS-1500 (11⁄2HP), S
- Page 212 and 213:
AUTOMATION 1 MAGNATECH 800 SERIES W
- Page 214 and 215:
AUTOMATION 1 MAGNATECH TUBESHEET WE
- Page 216 and 217:
1 AUTOMATION MAGNATECH PIPEMASTER 5
- Page 218 and 219:
1 AUTOMATION MAGNATECH PIPELINER II
- Page 220 and 221:
AUTOMATION 1 MAGNATECH WELDING TRAC
- Page 222 and 223:
KITS COMET EDGE CUSTOM 4 PACK 2 Par
- Page 224 and 225:
KITS REGULATORS - WELDING, CUTTING,
- Page 226 and 227:
KITS GAS EQUIPMENT TURBOTORCH® 2 E
- Page 228 and 229:
2 REGULATORS COMET EDGE ESS3 CO2 RE
- Page 230 and 231:
2 REGULATORS COMET EDGE ESS4 NITROG
- Page 232 and 233:
REGULATORS GENUINE COMET 5000 HIGH
- Page 234 and 235:
REGULATORS CUTSKILL OXYGEN REGULATO
- Page 236 and 237:
BLOWPIPES AND ATTACHMENTS GENUINE C
- Page 238 and 239:
BLOWPIPES AND ATTACHMENTS 2 GENUINE
- Page 240 and 241:
BLOWPIPES AND ATTACHMENTS 2 GENUINE
- Page 242 and 243:
CUTTING NOZZLES GENUINE COMET TYPE
- Page 244 and 245:
CUTTING NOZZLES CUTSKILL TYPE 41 CU
- Page 246 and 247:
WELDING AND HEATING GENUINE COMET O
- Page 248 and 249:
WELDING AND HEATING GENUINE COMET S
- Page 250 and 251:
HOSES AND FITTINGS FITTED HOSES AND
- Page 252 and 253:
HOSES AND FITTINGS TWIN GAS HOSES (
- Page 254 and 255:
2 ACCESSORIES GENUINE COMET FLASHBA
- Page 256 and 257:
ACCESSORIES FLINT LIGHTER Metal Cup
- Page 258 and 259:
MACHINES 2 PIPEMATE Specifications
- Page 260 and 261:
GAS HEATING HANDPIECE 2 EXPANSION B
- Page 262 and 263:
GAS HEATING SIEVERT FLOWCHART 2 NEC
- Page 264 and 265:
INDUSTRIAL GASES These pages have b
- Page 266 and 267:
GASES Shielding gas selection chart
- Page 268 and 269:
GASES SHIELDING GASES 3 MCW INDUSTR
- Page 270 and 271:
GASES SHIELDING GASES 3 Heavy INDUS
- Page 272 and 273:
GASES SHIELDING GASES Copper INDUST
- Page 274 and 275:
RESPIRATORY CLEANSPACE2 POWERED RES
- Page 276 and 277:
RESPIRATORY PROTECTION REUSABLE RES
- Page 278 and 279:
HEAD AND FACE 3M VERSAFLO FACE SHIE
- Page 280 and 281:
HEAD AND FACE HELMETS AND PARTS D63
- Page 282 and 283:
HEAD AND FACE HIDEROK WELDING HELME
- Page 284 and 285:
HEAD AND FACE WELDING GOGGLES PART
- Page 286 and 287:
HEAD AND FACE DISPOSABLE & REUSABLE
- Page 288 and 289:
HEAD AND FACE 3M VERSAFLO 4 3M VERS
- Page 290 and 291:
HEAD AND FACE WORKPLACE EYEWEAR UVE
- Page 292 and 293:
HEAD AND FACE WORKPLACE EYEWEAR UVE
- Page 294 and 295:
HEAD AND FACE UVEX EYEWEAR ACCESSOR
- Page 296 and 297:
HEAD AND FACE WORKPLACE EYEWEAR ONI
- Page 298 and 299:
HAND PROTECTION MARKING AS PER AS/N
- Page 300 and 301:
HAND PROTECTION GLOVES RIGGER GLOVE
- Page 302 and 303:
HAND PROTECTION WELDING GLOVES SUPE
- Page 304 and 305:
HAND PROTECTION KEVLAR® HEAT PROTE
- Page 306 and 307:
WELDING & GENERAL APPAREL CHROME LE
- Page 308 and 309:
WELDING & GENERAL APPAREL BIG RED®
- Page 310 and 311:
WELDING & GENERAL APPAREL WAKATAC S
- Page 312 and 313:
WELDING & GENERAL APPAREL CHROME LE
- Page 314 and 315:
WELDING BLANKETS & DRAPES WELDING D
- Page 316 and 317:
FUME EQUIPMENT MINIVEYOR AIR VAF CO
- Page 318 and 319:
ELECTRODES MILD STEEL & IRON POWDER
- Page 320 and 321:
ELECTRODES MILD STEEL & IRON POWDER
- Page 322 and 323:
ELECTRODES MILD STEEL & IRON POWDER
- Page 324 and 325:
ELECTRODES MILD STEEL & IRON POWDER
- Page 326 and 327:
ELECTRODES MILD STEEL & IRON POWDER
- Page 328 and 329:
ELECTRODES LOW HYDROGEN 5 FERROCRAF
- Page 330 and 331:
ELECTRODES LOW HYDROGEN FERROCRAFT
- Page 332 and 333:
ELECTRODES LOW HYDROGEN ALLOYCRAFT
- Page 334 and 335:
ELECTRODES LOW HYDROGEN EASYARC TM
- Page 336 and 337:
ELECTRODES LOW HYDROGEN KRYO® 3 Lo
- Page 338 and 339:
ELECTRODES LOW HYDROGEN KOBE ELECTR
- Page 340 and 341:
ELECTRODES LOW HYDROGEN OK 53.70 Ty
- Page 342 and 343:
ELECTRODES LOW HYDROGEN OK 74.46 (N
- Page 344 and 345:
ELECTRODES LOW HYDROGEN OK 76.18 Ty
- Page 346 and 347:
ELECTRODES LOW HYDROGEN AUSTARC 16T
- Page 348 and 349:
ELECTRODES STAINLESS STEEL & SPECIA
- Page 350 and 351:
ELECTRODES STAINLESS STEEL & SPECIA
- Page 352 and 353:
ELECTRODES STAINLESS STEEL & SPECIA
- Page 354 and 355:
ELECTRODES STAINLESS STEEL & SPECIA
- Page 356 and 357:
ELECTRODES STAINLESS STEEL & SPECIA
- Page 358 and 359:
ELECTRODES STAINLESS STEEL & SPECIA
- Page 360 and 361:
ELECTRODES STAINLESS STEEL & SPECIA
- Page 362 and 363:
ELECTRODES HARD FACING COBALARC AUS
- Page 364 and 365:
ELECTRODES HARD FACING 5 COBALARC 7
- Page 366 and 367:
ELECTRODES HARD FACING 5 STOODY TUB
- Page 368 and 369:
WIRES MIG AUTOCRAFT LW1 ALL POSITIO
- Page 370 and 371:
WIRES MIG AUTOCRAFT MN-MO ALL POSIT
- Page 372 and 373:
WIRES MIG AUTOCRAFT 309LSi ALL POSI
- Page 374 and 375:
WIRES MIG AUTOCRAFT AL5356 ALL POSI
- Page 376 and 377:
WIRES MIG 5 CONSUMABLES 374 AVESTA
- Page 378 and 379:
WIRES MIG SM-70 CO 2 /Ar+CO 2 5 AWS
- Page 380 and 381:
WIRES MIG SM-308L AWS A5.9 / ASME S
- Page 382 and 383:
WIRES MIG LINCOLN 308LSi Designed f
- Page 384 and 385:
WIRES FLUX CORED SATIN-COR XP 5 Sat
- Page 386 and 387:
5 WIRES FLUX CORED VERTI-COR 3XP Ve
- Page 388 and 389:
5 WIRES FLUX CORED VERTI-COR 111 K3
- Page 390 and 391:
WIRES FLUX CORED NICORE® 55 5 Nico
- Page 392 and 393:
WIRES FLUX CORED STOODY SOS 308L 5
- Page 394 and 395:
(Gas Shielded) FLUX CORED WIRES OUT
- Page 396 and 397:
WIRES FLUX CORED INNERSHIELD® NR-2
- Page 398 and 399:
WIRES FLUX CORED KOBE FLUX CORED WI
- Page 400 and 401:
WIRES FLUX CORED SF-71 CO 2 5 AWS A
- Page 402 and 403:
WIRES FLUX CORED SUPERCORED 70B CO
- Page 404 and 405:
WIRES FLUX CORED SC-80D2 CO 2 AWS A
- Page 406 and 407:
WIRES FLUX CORED DUAL SHIELD 7100 A
- Page 408 and 409:
WIRES FLUX CORED DUAL SHIELD II 110
- Page 410 and 411:
WIRES FLUX CORED COREWELD 111 ULTRA
- Page 412 and 413:
WIRES FLUX CORED SHIELD-BRIGHT 308L
- Page 414 and 415:
WIRES FLUX CORED SHIELD-BRIGHT 316L
- Page 416 and 417:
WIRES HARD FACING 5 STOODY DYNAMANG
- Page 418 and 419:
WIRES HARD FACING 5 STOODY 101 HC-G
- Page 420 and 421:
WIRES HARD FACING LINCORE® 33 Prov
- Page 422 and 423:
WIRES HARD FACING LINCORE® 60-O Re
- Page 424 and 425:
SUB ARC WIRES AND FLUXES AUTOCRAFT
- Page 426 and 427:
SUB ARC WIRES AND FLUXES QR-8045 Al
- Page 428 and 429:
SUB ARC WIRES AND FLUXES LINCOLNWEL
- Page 430 and 431:
SUB ARC WIRES AND FLUXES 8500 A hig
- Page 432 and 433:
SUB ARC WIRES AND FLUXES 5 CONSUMAB
- Page 434 and 435:
SUB ARC WIRES AND FLUXES OK FLUX 10
- Page 436 and 437:
SUB ARC WIRES AND FLUXES OK FLUX 10
- Page 438 and 439:
SUB ARC WIRES AND FLUXES OK AUTROD
- Page 440 and 441:
GAS AND TIG CONSUMABLES COMWELD LW1
- Page 442 and 443:
GAS AND TIG CONSUMABLES COMWELD CRM
- Page 444 and 445:
GAS AND TIG CONSUMABLES COMWELD AL1
- Page 446 and 447:
GAS AND TIG CONSUMABLES COMWELD GEN
- Page 448 and 449:
GAS AND TIG CONSUMABLES COMWELD TOB
- Page 450 and 451:
GAS AND TIG CONSUMABLES COMWELD SIL
- Page 452 and 453:
GAS AND TIG CONSUMABLES LINCOLN 446
- Page 454 and 455:
GAS AND TIG CONSUMABLES AVESTA STAN
- Page 456 and 457:
ABRASIVES FLAT METAL CUTTING OFF WH
- Page 458 and 459:
ABRASIVES METAL DEPRESSED CENTRE GR
- Page 460 and 461:
ABRASIVES INDUSTRIAL WIRE BRUSHES T
- Page 462 and 463:
ABRASIVES INDUSTRIAL COATED ABRASIV
- Page 464 and 465:
ABRASIVES INDUSTRIAL COATED ABRASIV
- Page 466 and 467:
OTHER COMWELD 965 SOLDER (SOFT SILV
- Page 468 and 469: OTHER COMWELD 965 SOLDERING FLUX CO
- Page 470 and 471: CHEMICAL PRODUCTS AVESTA REDONE 240
- Page 472 and 473: CHEMICAL PRODUCTS 5 Avesta RedOne 1
- Page 474 and 475: TERMS & DEFINITIONS TERMS AND DEFIN
- Page 476 and 477: WELDING TYPES, POSITIONS & DEFECTS
- Page 478 and 479: WELDING TYPES, POSITIONS & DEFECTS
- Page 480 and 481: WELDING TYPES, POSITIONS & DEFECTS
- Page 482 and 483: WELDING TYPES, POSITIONS & DEFECTS
- Page 484 and 485: WELDING TYPES, POSITIONS & DEFECTS
- Page 486 and 487: SAFETY IN WELDING A) ARC RADIATION
- Page 488 and 489: CONSUMABLES CLASSIFICATION TABLES A
- Page 490 and 491: CONSUMABLES CLASSIFICATION TABLES A
- Page 492 and 493: CONSUMABLES CLASSIFICATION TABLES A
- Page 494 and 495: CONSUMABLES CLASSIFICATION TABLES A
- Page 496 and 497: CONSUMABLES CLASSIFICATION TABLES A
- Page 498 and 499: CONSUMABLES CLASSIFICATION TABLES A
- Page 500 and 501: CONSUMABLES CLASSIFICATION TABLES A
- Page 502 and 503: WELDING GUIDE GENERAL PROCEDURE IN
- Page 504 and 505: WELDING GUIDE PREHEAT DETERMINATION
- Page 506 and 507: WELDING GUIDE STEEL SPECIFICATIONS
- Page 508 and 509: WELDING GUIDE STEEL SPECIFICATIONS
- Page 510 and 511: WELDING GUIDE STEEL SPECIFICATIONS
- Page 512 and 513: WELDING GUIDE WELDING RECOMMENDATIO
- Page 514 and 515: WELDING GUIDE CONSUMABLES FOR WELDI
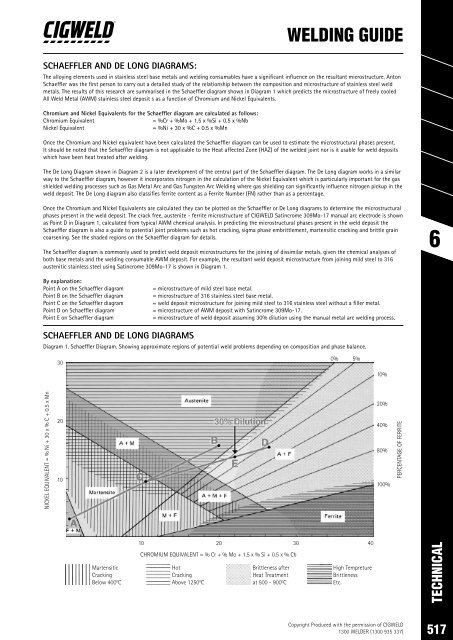
- Page 516 and 517: WELDING GUIDE AUSTENITIC STAINLESS
- Page 520 and 521: WELDING GUIDE SCHAEFFLER AND DE LON
- Page 522 and 523: WELDING GUIDE DEW POINT CONDITIONS
- Page 524 and 525: WELDING GUIDE 3) FEEDABILITY OF ALU
- Page 526 and 527: WELDING GUIDE 4) SMOKE TESTING ALUM
- Page 528 and 529: WELDING GUIDE 5) ARC LENGTH & HEAT
- Page 530 and 531: WELDING GUIDE ALUMINIUM ALLOY SELEC
- Page 532 and 533: WELDING GUIDE 1) ALUMINIUM BASE MET
- Page 534 and 535: WELDING GUIDE 2) TUNGSTEN ELECTRODE
- Page 536 and 537: WELDING GUIDE 5) GTAW (TIG) TECHNIQ
- Page 538 and 539: WELDING GUIDE TYPES OF CAST IRON CO
- Page 540 and 541: WELDING GUIDE PRECAUTIONS WHEN WELD
- Page 542 and 543: WELDING GUIDE SG CAST IRON Grey iro
- Page 544 and 545: WELDING GUIDE 1) TYPES OF COPPER AL
- Page 546 and 547: WELDING GUIDE 3) GAS METAL ARC WELD
- Page 548 and 549: WELDING GUIDE 7) BRAZE WELDING OF C
- Page 550 and 551: HARDFACING INFORMATION WHAT IS HARD
- Page 552 and 553: HARDFACING INFORMATION HOW TO CHOOS
- Page 554 and 555: HARDFACING INFORMATION COBALARC PRO
- Page 556 and 557: HARDFACING INFORMATION COBALARC APP
- Page 558 and 559: HARDFACING INFORMATION USE OF BUFFE
- Page 560 and 561: WELD COSTINGS COSTING INFORMATION:
- Page 562 and 563: DEPOSITION DATA GENERAL PROCESS EFF
- Page 564 and 565: DEPOSITION DATA SQUARE BUTT JOINTS,
- Page 566 and 567: FACTS & FIGURES MATHEMATICAL SYMBOL
- Page 568 and 569:
FACTS & FIGURES COMMON WELDING CONV
- Page 570 and 571:
FACTS & FIGURES CONVERSION TABLES -
- Page 572 and 573:
FACTS & FIGURES COMWELD RODS PER KG
- Page 574 and 575:
FACTS & FIGURES MASSES OF COMMON ME
- Page 576 and 577:
FACTS & FIGURES TEMPERATURE CONVERS
- Page 578 and 579:
FACTS & FIGURES GAS PRESSURES - GAS
- Page 580 and 581:
INFORMATION CONNECTORS SHELL Shell
- Page 582 and 583:
6 WARRANTY DATA LINCOLN ELECTRIC AU
- Page 584 and 585:
6 TECHNICAL 582 SPW GROUP PTY LTD
- Page 586 and 587:
IMPORTANT SAFETY INFORMATION IMPORT
- Page 588 and 589:
Guarantee and indemnity i/We: (here
- Page 590 and 591:
General terms and conditions of Sup
- Page 592 and 593:
NOTES 590 SPW GROUP PTY LTD
- Page 594 and 595:
NOTES 592 SPW GROUP PTY LTD
- Page 596:
WE HAVE THE BEST WELDING EQUIPMENT