The Virtualization Cookbook for SLES 10 SP2 - z/VM - IBM
The Virtualization Cookbook for SLES 10 SP2 - z/VM - IBM
The Virtualization Cookbook for SLES 10 SP2 - z/VM - IBM

Create successful ePaper yourself
Turn your PDF publications into a flip-book with our unique Google optimized e-Paper software.
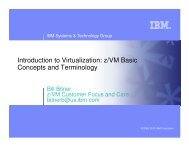
Figure 14-3 Per<strong>for</strong>mance Toolkit 3270 Interface Main Menu screen<br />
Drilling down into report screens<br />
You should now be able to use the active report screens. To drill down into these screens,<br />
move the cursor to any of the titles that are active (active titles display the number or letter in<br />
white, inactive titles are in green). Some of the more useful report screens to drill down into<br />
are:<br />
21. User resource usage<br />
22. User paging load<br />
23. User wait states<br />
28. User configuration<br />
29. Linux systems<br />
33. Benchmark displays<br />
For example to drill down into the Benchmark submenu screen, enter the following command:<br />
Command ===> 33<br />
<strong>The</strong>n type S over the period on the left side of the submenu screen in the row corresponding<br />
to the report you wish to see.<br />
14.3 Monitoring Linux<br />
FCX124 Per<strong>for</strong>mance Screen Selection (FL6<strong>10</strong> ) Perf. Monitor<br />
General System Data I/O Data History Data (by Time)<br />
1. CPU load and trans. 11. Channel load 31. Graphics selection<br />
2. Storage utilization 12. Control units 32. History data files*<br />
3. Reserved 13. I/O device load* 33. Benchmark displays*<br />
4. Priv. operations 14. CP owned disks* 34. Correlation coeff.<br />
5. System counters 15. Cache extend. func.* 35. System summary*<br />
6. CP IUCV services 16. DASD I/O assist 36. Auxiliary storage<br />
7. SPOOL file display* 17. DASD seek distance* 37. CP communications*<br />
8. LPAR data 18. I/O prior. queueing* 38. DASD load<br />
9. Shared segments 19. I/O configuration 39. Minidisk cache*<br />
A. Shared data spaces 1A. I/O config. changes 3A. Storage mgmt. data*<br />
B. Virt. disks in stor. 3B. Proc. load & config*<br />
C. Transact. statistics User Data 3C. Logical part. load<br />
D. Monitor data 21. User resource usage* 3D. Response time (all)*<br />
E. Monitor settings 22. User paging load* 3E. RSK data menu*<br />
F. System settings 23. User wait states* 3F. Scheduler queues<br />
G. System configuration 24. User response time* 3G. Scheduler data<br />
H. <strong>VM</strong> Resource Manager 25. Resources/transact.* 3H. SFS/BFS logs menu*<br />
26. User communication* 3I. System log<br />
I. Exceptions 27. Multitasking users* 3K. TCP/IP data menu*<br />
28. User configuration* 3L. User communication<br />
K. User defined data* 29. Linux systems* 3M. User wait states<br />
Measurements can show resource consumption of the Linux guest as measured and<br />
dispatched by the <strong>VM</strong> host. It is also possible to measure per<strong>for</strong>mance data from within the<br />
Linux guest itself. To monitor Linux per<strong>for</strong>mance data at this level, a data gatherer process<br />
must be running within each Linux guest you wish to monitor. <strong>The</strong>re are different ways of<br />
236 <strong>The</strong> <strong>Virtualization</strong> <strong>Cookbook</strong> <strong>for</strong> RHEL 6