Global Burden of Armed Violence - The Geneva Declaration on ...
Global Burden of Armed Violence - The Geneva Declaration on ...
Global Burden of Armed Violence - The Geneva Declaration on ...

You also want an ePaper? Increase the reach of your titles
YUMPU automatically turns print PDFs into web optimized ePapers that Google loves.
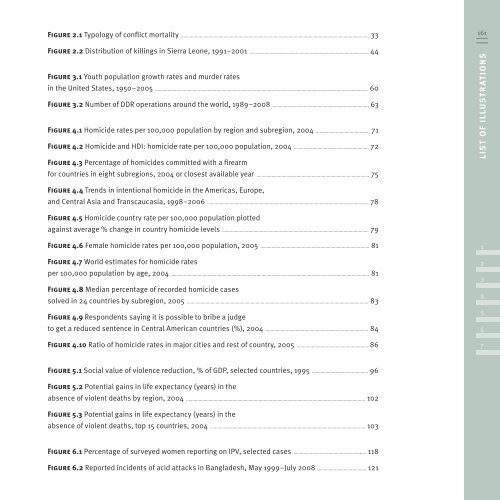
Figure 2.1 Typology <str<strong>on</strong>g>of</str<strong>on</strong>g> c<strong>on</strong>flict mortality ...................................................................................................................................................... 33<br />
Figure 2.2 Distributi<strong>on</strong> <str<strong>on</strong>g>of</str<strong>on</strong>g> killings in Sierra Le<strong>on</strong>e, 1991–2001 ............................................................................................... 44<br />
Figure 3.1 Youth populati<strong>on</strong> growth rates and murder rates<br />
in the United States, 1950–2005 .......................................................................................................................................................................... 60<br />
Figure 3.2 Number <str<strong>on</strong>g>of</str<strong>on</strong>g> DDR operati<strong>on</strong>s around the world, 1989–2008 ............................................................................. 63<br />
Figure 4.1 Homicide rates per 100,000 populati<strong>on</strong> by regi<strong>on</strong> and subregi<strong>on</strong>, 2004 ........................................... 71<br />
Figure 4.2 Homicide and HDI: homicide rate per 100,000 populati<strong>on</strong>, 2004 ............................................................ 72<br />
Figure 4.3 Percentage <str<strong>on</strong>g>of</str<strong>on</strong>g> homicides committed with a firearm<br />
for countries in eight subregi<strong>on</strong>s, 2004 or closest available year .......................................................................................... 75<br />
Figure 4.4 Trends in intenti<strong>on</strong>al homicide in the Americas, Europe,<br />
and Central Asia and Trans caucasia, 1998–2006 ................................................................................................................................. 78<br />
Figure 4.5 Homicide country rate per 100,000 populati<strong>on</strong> plotted<br />
against average % change in country homicide levels ..................................................................................................................... 79<br />
Figure 4.6 Female homicide rates per 100,000 populati<strong>on</strong>, 2005 ....................................................................................... 81<br />
Figure 4.7 World estimates for homicide rates<br />
per 100,000 populati<strong>on</strong> by age, 2004 .............................................................................................................................................................. 81<br />
Figure 4.8 Median percentage <str<strong>on</strong>g>of</str<strong>on</strong>g> recorded homicide cases<br />
solved in 24 countries by subregi<strong>on</strong>, 2005 ................................................................................................................................................. 83<br />
Figure 4.9 Resp<strong>on</strong>dents saying it is possible to bribe a judge<br />
to get a reduced sentence in Central American countries (%), 2004 .................................................................................. 84<br />
Figure 4.10 Ratio <str<strong>on</strong>g>of</str<strong>on</strong>g> homicide rates in major cities and rest <str<strong>on</strong>g>of</str<strong>on</strong>g> country, 2005 ......................................................... 86<br />
Figure 5.1 Social value <str<strong>on</strong>g>of</str<strong>on</strong>g> violence reducti<strong>on</strong>, % <str<strong>on</strong>g>of</str<strong>on</strong>g> GDP, selected countries, 1995 ............................................. 96<br />
Figure 5.2 Potential gains in life expectancy (years) in the<br />
absence <str<strong>on</strong>g>of</str<strong>on</strong>g> violent deaths by regi<strong>on</strong>, 2004 ............................................................................................................................................... 102<br />
Figure 5.3 Potential gains in life expectancy (years) in the<br />
absence <str<strong>on</strong>g>of</str<strong>on</strong>g> violent deaths, top 15 countries, 2004 ............................................................................................................................ 103<br />
Figure 6.1 Percentage <str<strong>on</strong>g>of</str<strong>on</strong>g> surveyed women reporting <strong>on</strong> IPV, selected cases .......................................................... 118<br />
Figure 6.2 Reported incidents <str<strong>on</strong>g>of</str<strong>on</strong>g> acid attacks in Bangladesh, May 1999–July 2008 ....................................... 121<br />
161<br />
L IS T OF ILLUS T R AT I O N S<br />
1<br />
2<br />
3<br />
4<br />
5<br />
6<br />
7