Global Burden of Armed Violence - The Geneva Declaration on ...
Global Burden of Armed Violence - The Geneva Declaration on ...
Global Burden of Armed Violence - The Geneva Declaration on ...

You also want an ePaper? Increase the reach of your titles
YUMPU automatically turns print PDFs into web optimized ePapers that Google loves.
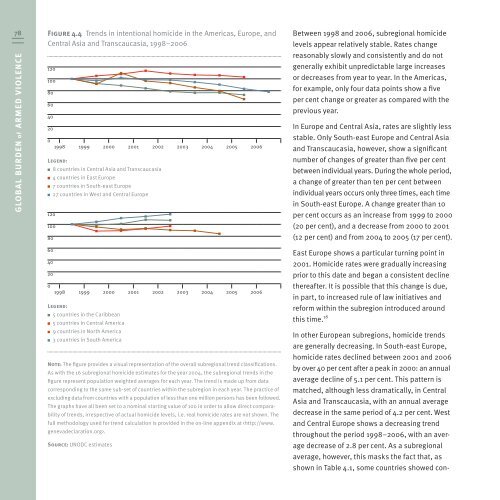
78 Figure 4.4 Trends in intenti<strong>on</strong>al homicide in the Americas, Europe, and<br />
Central Asia and Transcaucasia, 1998–2006<br />
GLOBAL BURDEN <str<strong>on</strong>g>of</str<strong>on</strong>g> ARMED VIOLENCE<br />
120<br />
100<br />
80<br />
60<br />
40<br />
20<br />
0<br />
1998 1999 2000 2001 2002 2003 2004 2005 2006<br />
Legend:<br />
120<br />
100<br />
80<br />
60<br />
40<br />
20<br />
8 countries in Central Asia and Transcaucasia<br />
4 countries in East Europe<br />
7 countries in South-east Europe<br />
27 countries in West and Central Europe<br />
0<br />
1998 1999 2000 2001 2002 2003 2004 2005 2006<br />
Legend:<br />
5 countries in the Caribbean<br />
5 countries in Central America<br />
9 countries in North America<br />
3 countries in South America<br />
Note: <str<strong>on</strong>g>The</str<strong>on</strong>g> figure provides a visual representati<strong>on</strong> <str<strong>on</strong>g>of</str<strong>on</strong>g> the overall subregi<strong>on</strong>al trend classificati<strong>on</strong>s.<br />
As with the 16 subregi<strong>on</strong>al homicide estimates for the year 2004, the subregi<strong>on</strong>al trends in the<br />
figure represent populati<strong>on</strong> weighted averages for each year. <str<strong>on</strong>g>The</str<strong>on</strong>g> trend is made up from data<br />
corresp<strong>on</strong>ding to the same sub-set <str<strong>on</strong>g>of</str<strong>on</strong>g> countries within the subregi<strong>on</strong> in each year. <str<strong>on</strong>g>The</str<strong>on</strong>g> practice <str<strong>on</strong>g>of</str<strong>on</strong>g><br />
excluding data from countries with a populati<strong>on</strong> <str<strong>on</strong>g>of</str<strong>on</strong>g> less than <strong>on</strong>e milli<strong>on</strong> pers<strong>on</strong>s has been followed.<br />
<str<strong>on</strong>g>The</str<strong>on</strong>g> graphs have all been set to a nominal starting value <str<strong>on</strong>g>of</str<strong>on</strong>g> 100 in order to allow direct compara-<br />
bility <str<strong>on</strong>g>of</str<strong>on</strong>g> trends, irrespective <str<strong>on</strong>g>of</str<strong>on</strong>g> actual homicide levels, i.e. real homicide rates are not shown. <str<strong>on</strong>g>The</str<strong>on</strong>g><br />
full methodology used for trend calculati<strong>on</strong> is provided in the <strong>on</strong>-line appendix at .<br />
Source: UNODC estimates<br />
Between 1998 and 2006, subregi<strong>on</strong>al homicide<br />
levels appear relatively stable. Rates change<br />
reas<strong>on</strong>ably slowly and c<strong>on</strong>sistently and do not<br />
generally exhibit unpredictable large increases<br />
or decreases from year to year. In the Americas,<br />
for example, <strong>on</strong>ly four data points show a five<br />
per cent change or greater as compared with the<br />
previous year.<br />
In Europe and Central Asia, rates are slightly less<br />
stable. Only South-east Europe and Central Asia<br />
and Transcaucasia, however, show a significant<br />
number <str<strong>on</strong>g>of</str<strong>on</strong>g> changes <str<strong>on</strong>g>of</str<strong>on</strong>g> greater than five per cent<br />
between individual years. During the whole period,<br />
a change <str<strong>on</strong>g>of</str<strong>on</strong>g> greater than ten per cent between<br />
individual years occurs <strong>on</strong>ly three times, each time<br />
in South-east Europe. A change greater than 10<br />
per cent occurs as an increase from 1999 to 2000<br />
(20 per cent), and a decrease from 2000 to 2001<br />
(12 per cent) and from 2004 to 2005 (17 per cent).<br />
East Europe shows a particular turning point in<br />
2001. Homicide rates were gradually increasing<br />
prior to this date and began a c<strong>on</strong>sistent decline<br />
thereafter. It is possible that this change is due,<br />
in part, to increased rule <str<strong>on</strong>g>of</str<strong>on</strong>g> law initiatives and<br />
reform within the subregi<strong>on</strong> introduced around<br />
this time. 18<br />
In other European subregi<strong>on</strong>s, homicide trends<br />
are generally decreasing. In South-east Europe,<br />
homicide rates declined between 2001 and 2006<br />
by over 40 per cent after a peak in 2000: an annual<br />
average decline <str<strong>on</strong>g>of</str<strong>on</strong>g> 5.1 per cent. This pattern is<br />
matched, although less dramatically, in Central<br />
Asia and Transcaucasia, with an annual average<br />
decrease in the same period <str<strong>on</strong>g>of</str<strong>on</strong>g> 4.2 per cent. West<br />
and Central Europe shows a decreasing trend<br />
throughout the period 1998–2006, with an aver-<br />
age decrease <str<strong>on</strong>g>of</str<strong>on</strong>g> 2.8 per cent. As a subregi<strong>on</strong>al<br />
average, however, this masks the fact that, as<br />
shown in Table 4.1, some countries showed c<strong>on</strong>-