Download - Volksbank AG
Download - Volksbank AG
Download - Volksbank AG

Create successful ePaper yourself
Turn your PDF publications into a flip-book with our unique Google optimized e-Paper software.
THE BANK FOR CORPORATES<br />
4<br />
Key figures<br />
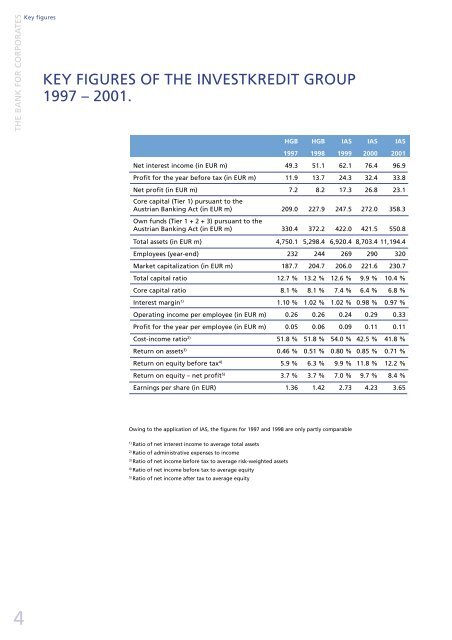
KEY FIGURES OF THE INVESTKREDIT GROUP<br />
1997 – 2001.<br />
HGB HGB IAS IAS IAS<br />
1997 1998 1999 2000 2001<br />
Net interest income (in EUR m) 49.3 51.1 62.1 76.4 96.9<br />
Profit for the year before tax (in EUR m) 11.9 13.7 24.3 32.4 33.8<br />
Net profit (in EUR m)<br />
Core capital (Tier 1) pursuant to the<br />
7.2 8.2 17.3 26.8 23.1<br />
Austrian Banking Act (in EUR m)<br />
Own funds (Tier 1 + 2 + 3) pursuant to the<br />
209.0 227.9 247.5 272.0 358.3<br />
Austrian Banking Act (in EUR m) 330.4 372.2 422.0 421.5 550.8<br />
Total assets (in EUR m) 4,750.1 5,298.4 6,920.4 8,703.4 11,194.4<br />
Employees (year-end) 232 244 269 290 320<br />
Market capitalization (in EUR m) 187.7 204.7 206.0 221.6 230.7<br />
Total capital ratio 12.7 % 13.2 % 12.6 % 9.9 % 10.4 %<br />
Core capital ratio 8.1 % 8.1 % 7.4 % 6.4 % 6.8 %<br />
Interest margin1) 1.10 % 1.02 % 1.02 % 0.98 % 0.97 %<br />
Operating income per employee (in EUR m) 0.26 0.26 0.24 0.29 0.33<br />
Profit for the year per employee (in EUR m) 0.05 0.06 0.09 0.11 0.11<br />
Cost-income ratio2) 51.8 % 51.8 % 54.0 % 42.5 % 41.8 %<br />
Return on assets3) 0.46 % 0.51 % 0.80 % 0.85 % 0.71 %<br />
Return on equity before tax4) 5.9 % 6.3 % 9.9 % 11.8 % 12.2 %<br />
Return on equity – net profit5) 3.7 % 3.7 % 7.0 % 9.7 % 8.4 %<br />
Earnings per share (in EUR) 1.36 1.42 2.73 4.23 3.65<br />
Owing to the application of IAS, the figures for 1997 and 1998 are only partly comparable<br />
1) Ratio of net interest income to average total assets<br />
2) Ratio of administrative expenses to income<br />
3) Ratio of net income before tax to average risk-weighted assets<br />
4) Ratio of net income before tax to average equity<br />
5) Ratio of net income after tax to average equity