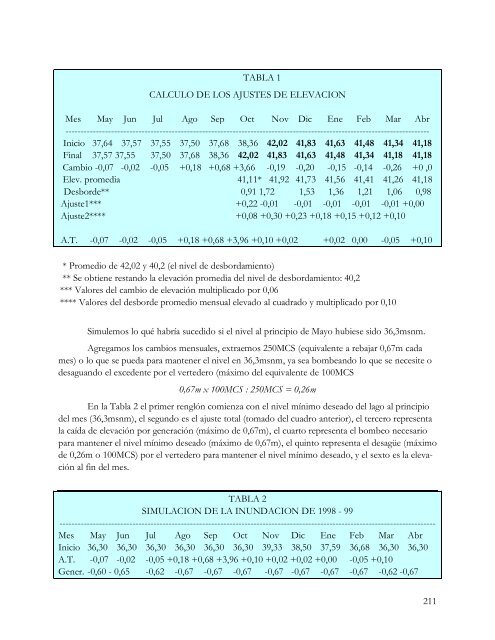
TABLA 1 CALCULO DE LOS AJUSTES DE ELEVACION Mes May Jun Jul Ago Sep Oct <strong>No</strong>v Dic Ene Feb Mar Abr ------------------------------------------------------------------------------------------------------------------------ Inicio 37,64 37,57 37,55 37,50 37,68 38,36 42,02 41,83 41,63 41,48 41,34 41,18 Final 37,57 37,55 37,50 37,68 38,36 42,02 41,83 41,63 41,48 41,34 41,18 41,18 Cambio -0,07 -0,02 -0,05 +0,18 +0,68 +3,66 -0,19 -0,20 -0,15 -0,14 -0,26 +0 ,0 Elev. promedia 41,11* 41,92 41,73 41,56 41,41 41,26 41,18 Desbor<strong>de</strong>** 0,91 1,72 1,53 1,36 1,21 1,06 0,98 Ajuste1*** +0,22 -0,01 -0,01 -0,01 -0,01 -0,01 +0,00 Ajuste2**** +0,08 +0,30 +0,23 +0,18 +0,15 +0,12 +0,10 A.T. -0,07 -0,02 -0,05 +0,18 +0,68 +3,96 +0,10 +0,02 +0,02 0,00 -0,05 +0,10 * Promedio <strong>de</strong> 42,02 y 40,2 (el nivel <strong>de</strong> <strong>de</strong>sbordamiento) ** Se obtiene restando la elevación promedia <strong>de</strong>l nivel <strong>de</strong> <strong>de</strong>sbordamiento: 40,2 *** Valores <strong>de</strong>l cambio <strong>de</strong> elevación multiplicado por 0,06 **** Valores <strong>de</strong>l <strong>de</strong>sbor<strong>de</strong> promedio mensual elevado al cuadrado y multiplicado por 0,10 Simulemos lo qué habría sucedido si el nivel al principio <strong>de</strong> Mayo hubiese sido 36,3msnm. Agregamos los cambios mensuales, extraemos 250MCS (equivalente a rebajar 0,67m cada mes) o lo que se pueda para mantener el nivel en 36,3msnm, ya sea bombeando lo que se necesite o <strong>de</strong>saguando el exce<strong>de</strong>nte por el verte<strong>de</strong>ro (máximo <strong>de</strong>l equivalente <strong>de</strong> 100MCS 0,67m x 100MCS : 250MCS = 0,26m En la Tabla 2 el primer renglón comienza con el nivel mínimo <strong>de</strong>seado <strong>de</strong>l lago al principio <strong>de</strong>l mes (36,3msnm), el segundo es el ajuste total (tomado <strong>de</strong>l cuadro anterior), el tercero representa la caída <strong>de</strong> elevación por generación (máximo <strong>de</strong> 0,67m), el cuarto representa el bombeo necesario para mantener el nivel mínimo <strong>de</strong>seado (máximo <strong>de</strong> 0,67m), el quinto representa el <strong>de</strong>sagüe (máximo <strong>de</strong> 0,26m o 100MCS) por el verte<strong>de</strong>ro para mantener el nivel mínimo <strong>de</strong>seado, y el sexto es la eleva- ción al fin <strong>de</strong>l mes. TABLA 2 SIMULACION DE LA INUNDACION DE 1998 - 99 ---------------------------------------------------------------------------------------------------------------------------- Mes May Jun Jul Ago Sep Oct <strong>No</strong>v Dic Ene Feb Mar Abr Inicio 36,30 36,30 36,30 36,30 36,30 36,30 39,33 38,50 37,59 36,68 36,30 36,30 A.T. -0,07 -0,02 -0,05 +0,18 +0,68 +3,96 +0,10 +0,02 +0,02 +0,00 -0,05 +0,10 Gener. -0,60 - 0,65 -0,62 -0,67 -0,67 -0,67 -0,67 -0,67 -0,67 -0,67 -0,62 -0,67 211
Bomb. +0,67 +0,67 +0,67 +0,49 0,0 0,0 0,0 0,0 0,0 +0,29 +0,67 +0,57 Verted. -0,01 -0,26 -0,26 -0,26 -0,26 Final 36,30 36,30 36,30 36,30 36,30 39,33 38,50 37,59 36,68 36,30 36,30 36,30 Obsérvese que, mediante las acciones combinadas <strong>de</strong>l bombeo (+4,03m en todo el año) y <strong>de</strong>l verte<strong>de</strong>ro (-1,05m en todo el año), el nivel máximo habría sido 39,33msnm (0,87m por <strong>de</strong>bajo <strong>de</strong>l nivel <strong>de</strong> <strong>de</strong>sbordamiento), se habría podido llegar al siguiente invierno con la elevación <strong>de</strong>seada, 36,3msnm, y se habría generado el equivalente a una altura <strong>de</strong> 7,85m. Segunda simulación. Tratemos ahora con el año siguiente a la llena <strong>de</strong>l huracán Mitch, 1999 - 2000. Calculemos primero los ajustes <strong>de</strong> la forma que fue indicado anteriormente. TABLA 3 CALCULO DE LOS AJUSTES DE ELEVACION Mes May Jun Jul Ago Sep Oct <strong>No</strong>v Dic Ene Feb Mar Abr ---------------------------------------------------------------------------------------------------------------------------- Inicio 41,18 41,18 41,35 41,21 41,46 42,26 42,02 41,84 41,50 41,24 41,00 40,79 Final 41,18 41,35 41,21 41,46 42,26 42,02 41,84 41,50 41,24 41,00 40,79 40,61 Cambio 0,0 +0,17 -0,14 +0,25 +0,80 -0,24 -0,18 -0,34 -0,26 -0,24 -0,21 -0,18 Prom. 41,18 41,27 41,28 41,34 41,86 42,14 41,93 41,67 41,37 41,12 40,90 40,70 Desb. 0,98 1,07 1,08 1,14 1,66 1,94 1,73 1,47 1,17 0,92 0,70 0,50 Ajuste1+0,0 +0,01 -0,01 +0,02 +0,05 -0,01 -0,01 -0,02 -0,02 -0,01 -0,01 -0,01 Ajuste2+0,10 +0,11 +0,12 +0,13 +0,28 +0,38 +0,30 +0,22 +0,14 +0,09 +0,05 +0,03 A.T. +0,10 +0,29 -0,03 +0,40 +1,13 +0,13 +0,11 -0,14 -0,14 -0,16 -0,17 -0,16 Pasamos ahora a hacer la simulación. Los renglones <strong>de</strong> la tabla 4 tienen el mismo significado que en la tabla 2. TABLA 4 SIMULACION DE LOS AÑOS 1999-2000 Mes May Jun Jul Ago Sep Oct <strong>No</strong>v Dic Ene Feb Mar Abr Inicio 36,30 36,30 36,30 36,30 36,30 36,50 36,30 36,30 36,30 36,30 36,30 36,30 A.T. +0,10 +0,29 -0,03 +0,40 +1,13 +0,13 +0,11 -0,14 -0,14 -0,16 -0,17 -0,16 Gen. -0,67 -0,67 -0,64 -0,67 -0,67 -0,67 -0,67 -0,53 -0,53 -0,51 -0,50 -0,51 Bomb. +0,57 +0,38 +0,67 +0,27 +0,00 +0,34 +0,56 +0,67 +0,67 +0,67 +0,67 +0,67 Vert. -0,26 Final 36,30 36,30 36,30 36,30 36,50 36,30 36,30 36,30 36,30 36,30 36,30 36,30 212
- Page 2 and 3:
No. 58 - Febrero 2013 ISSN 2164-426
- Page 4 and 5:
Editor: José Mejía Lacayo jmejial
- Page 6 and 7:
no quiere decir que tenemos que rec
- Page 8 and 9:
yecto inicial había sido escrito.
- Page 10:
en 1729 cuando escribió al goberna
- Page 13 and 14:
Este descubrimiento había sido dir
- Page 15 and 16:
las dichas montañas, quienes viven
- Page 17 and 18:
En este cabo no reside ningún indi
- Page 19 and 20:
muy larga, sus ojos grandes y de mi
- Page 21 and 22:
últimamente hicieron con el capit
- Page 23 and 24:
primero es llamado Ben. Recientemen
- Page 25 and 26:
cuerpos al gusto de sus dientes; u
- Page 27 and 28:
De estas cascadas abajo hasta la bo
- Page 29 and 30:
estima ser sano y alimenticio, y ti
- Page 31 and 32:
caigan en las manos de los español
- Page 33 and 34:
El maíz, o gran trigo indio, que p
- Page 35 and 36:
Otra criatura, que los ingleses lla
- Page 37 and 38:
Delfines, peces voladores, marsopas
- Page 39 and 40:
Subject: Re: Edición No. 58 Date:
- Page 41 and 42:
España también abundan las constr
- Page 43 and 44:
El tapial es la formaleta de madera
- Page 45 and 46:
Y también estamos en la Biblioteca
- Page 47 and 48:
ENSAYOS De Cuatreros a Rebeldes a P
- Page 49 and 50:
(der.), Penitenciaría Nacional, Ma
- Page 51 and 52:
coerción organizada habían sido e
- Page 53 and 54:
Ilustración 2. Mapa de Las Segovia
- Page 55 and 56:
crédito; una densa red de relacio
- Page 57 and 58:
y la mano de obra de los pobres rur
- Page 59 and 60:
Liberales se irritaban a ratos, el
- Page 61 and 62:
en el departamento. Pastor Lobo era
- Page 63 and 64:
cual formalmente acabó con la guer
- Page 65 and 66:
sus enemigos y a todos los Liberale
- Page 67 and 68:
peletón de bandoleros armados en P
- Page 69 and 70:
duras eran según informes “lugar
- Page 71 and 72:
Léxico Modernista en los Verso de
- Page 73 and 74:
amor, en Zorrilla -lo cual implica
- Page 75 and 76:
“Palma —afirmó éste— es el
- Page 77 and 78:
un atractivo y un hechizo”. Zambr
- Page 79 and 80:
nada, que llegamos hasta inventar p
- Page 81 and 82:
Nació en Managua el 12 de Diciembr
- Page 83 and 84:
comité organizador del Festival In
- Page 85 and 86:
13. Omar J. Lazo Barberena (2012: 6
- Page 87 and 88:
una visión de la dinámica que se
- Page 89 and 90:
Leoncio Saenz, “padre del dibujo
- Page 91 and 92:
En los años ochenta viajo a Aleman
- Page 93 and 94:
enseñando pintura por un tiempo. L
- Page 95 and 96:
pecé a entender. Y vaya sorpresa l
- Page 97 and 98:
al Sr. Lic. Don Lorenzo Montufar, M
- Page 99 and 100:
El vapor “La Virgen” al ser tom
- Page 101 and 102:
cía profundos cambios en una corre
- Page 103 and 104:
quía granadina, expresada por la v
- Page 105 and 106:
esta nueva república centroamerica
- Page 107 and 108:
Durante la tercera semana del mes d
- Page 109 and 110:
Durante el año de 1867, en comunic
- Page 111 and 112:
“… Ejecutado el favor del desco
- Page 113 and 114:
El 23 de diciembre de 1857; Washin
- Page 115 and 116:
Su labor fue difundida internaciona
- Page 117 and 118:
manera que por nuestra parte fueron
- Page 119 and 120:
EL TRATADO MARTINEZ-MORA-BELLY, Riv
- Page 121 and 122:
Que suplican a los Gobiernos de las
- Page 123 and 124:
“… El Gobierno de los Estados U
- Page 125 and 126:
Alrededor de esta misma fecha, el P
- Page 127 and 128:
El nuevo Canciller Británico Lord
- Page 129 and 130:
Nicaragüense. El contenido de este
- Page 131 and 132:
“… Adjunto remito una copia de
- Page 133 and 134:
Obras, y por el Secretario Monsieur
- Page 135 and 136:
Pablo Hurtado Gago, A 160 Años en
- Page 137 and 138:
Señor Don Francisco Vijil Granada
- Page 139 and 140:
Señor: DIARIO DE NICARAGUA ORGANO
- Page 141 and 142:
(Austria.) Artículo 10 Las bancas-
- Page 143 and 144:
Señor Dr. don J. Bárcenas Meneses
- Page 145 and 146:
marcha del Gobierno. Voy a referir
- Page 147 and 148:
El Señor Presidente dijo entonces:
- Page 149 and 150:
En la línea de fuego, incluyendo 6
- Page 151 and 152:
En esos mismos momentos desmontaba
- Page 153 and 154:
El Gral. Don Joaquín Zavala fue un
- Page 155 and 156:
Una Junta de Notables nombró Presi
- Page 157 and 158:
dente y los Generales se encerraron
- Page 159 and 160:
Yo no soy el Jefe, y si lo fuera no
- Page 161 and 162: ——————— PREFACIO Orla
- Page 163 and 164: hasta Porto Bello. Intentó estable
- Page 165 and 166: CAPÍTULO I Falta de información c
- Page 167 and 168: so civilizado, una de sus instituci
- Page 169 and 170: comercio. Proseguimos, por su recom
- Page 171 and 172: deración, pidió al Rey, el 13 de
- Page 173 and 174: los pechos y un lado de la cara. En
- Page 175 and 176: efecto sobre sus cuerpos, y esto lo
- Page 177 and 178: Habiendo seleccionado y alquilado t
- Page 179 and 180: Después de residir por un tiempo e
- Page 181 and 182: asarlos en barbacoa. Esta operació
- Page 183 and 184: on en los distintas raudales como s
- Page 185 and 186: vida futura y de una Providencia to
- Page 187 and 188: cabeza. Sin embargo, esta vez iban
- Page 189 and 190: Los Bucaneros y comerciantes libres
- Page 191 and 192: Nota II Porto Bello se ha descrito
- Page 193 and 194: Salvador Mendieta en Diriamba, San
- Page 195 and 196: Entre los beneficios del gobierno d
- Page 197 and 198: Cubríalo cuando menor de edad, cá
- Page 199 and 200: Era en 1885 el quinto de seis hijos
- Page 201 and 202: escapatoria tuvo buen éxito hasta
- Page 203 and 204: puerta de salida y marcharon a la c
- Page 205 and 206: partido con la miseria y la mala su
- Page 207 and 208: Nadie sabe lo que el porvenir encie
- Page 209 and 210: Primera simulación. Comenzamos por
- Page 211: ) Ajuste por desbordamiento. No dis
- Page 215 and 216: Se podría objetar que el resultado
- Page 217 and 218: El 20 de enero del 2005 tuve el pri
- Page 219 and 220: y aquel europeo empezó a orientarl
- Page 221 and 222: Miguel le comentó que de los que s
- Page 223 and 224: Moisés Morales Arévalo a sus 81 a
- Page 225 and 226: GEOGRAFÍA Densidad de Población e
- Page 227 and 228: Jan Ehrenburg 3 El poblado de Santa
- Page 229 and 230: En el mapa municipal de desastres n
- Page 231 and 232: GLOSARIO Una caldera volcánica es
- Page 233 and 234: Nuestros libros de geografía suele
- Page 235 and 236: Lista de aparatos volcánicos No. N
- Page 237 and 238: ECONOMÍA Nicaragua: Condiciones Ec
- Page 239 and 240: COMPUTACIÓN Protección contra las
- Page 241 and 242: seleccione la casilla junto a "Acti