Establecimiento de cuatro especies de Quercus en el sur de la ...
Establecimiento de cuatro especies de Quercus en el sur de la ...
Establecimiento de cuatro especies de Quercus en el sur de la ...

Create successful ePaper yourself
Turn your PDF publications into a flip-book with our unique Google optimized e-Paper software.
Capítulo 3<br />
distribution were <strong>de</strong>v<strong>el</strong>oped, residuals of all mo<strong>de</strong>ls (including both regression and<br />
ANOVA ones) were checked for autocorr<strong>el</strong>ation by building spatial corr<strong>el</strong>ograms but no<br />
significant patterns were found, and thus in<strong>de</strong>p<strong>en</strong><strong>de</strong>nce could be saf<strong>el</strong>y assumed (Keitt<br />
et al., 2002; Lichstein et al., 2002). Non spatial statistical analyses were done with the<br />
software STATISTICA 8.0. (Statsoft, Inc.) and R version 2.9.1 (R Dev<strong>el</strong>opm<strong>en</strong>t Core<br />
Team 2009).<br />
RESULTS<br />
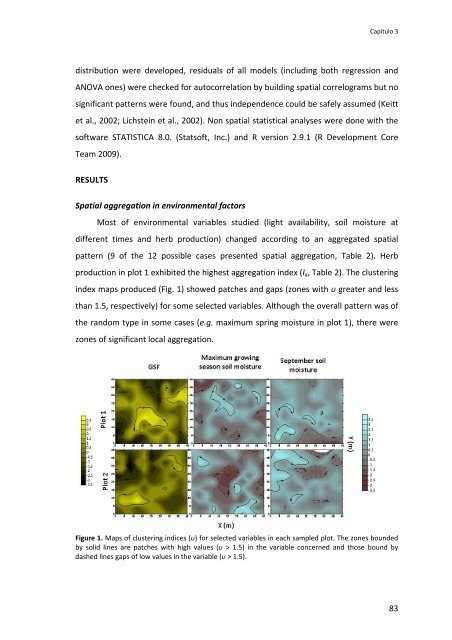
Spatial aggregation in <strong>en</strong>vironm<strong>en</strong>tal factors<br />
Most of <strong>en</strong>vironm<strong>en</strong>tal variables studied (light avai<strong>la</strong>bility, soil moisture at<br />
differ<strong>en</strong>t times and herb production) changed according to an aggregated spatial<br />
pattern (9 of the 12 possible cases pres<strong>en</strong>ted spatial aggregation, Table 2). Herb<br />
production in plot 1 exhibited the highest aggregation in<strong>de</strong>x (I a , Table 2). The clustering<br />
in<strong>de</strong>x maps produced (Fig. 1) showed patches and gaps (zones with υ greater and less<br />
than 1.5, respectiv<strong>el</strong>y) for some s<strong>el</strong>ected variables. Although the overall pattern was of<br />
the random type in some cases (e.g. maximum spring moisture in plot 1), there were<br />
zones of significant local aggregation.<br />
Figure 1. Maps of clustering indices (υ) for s<strong>el</strong>ected variables in each sampled plot. The zones boun<strong>de</strong>d<br />
by solid lines are patches with high values (υ > 1.5) in the variable concerned and those bound by<br />
dashed lines gaps of low values in the variable (υ > 1.5).<br />
83