Establecimiento de cuatro especies de Quercus en el sur de la ...
Establecimiento de cuatro especies de Quercus en el sur de la ...
Establecimiento de cuatro especies de Quercus en el sur de la ...

Create successful ePaper yourself
Turn your PDF publications into a flip-book with our unique Google optimized e-Paper software.
Spatial and temporal heterog<strong>en</strong>eity effects on seedling growth and establishm<strong>en</strong>t in four <strong>Quercus</strong> species<br />
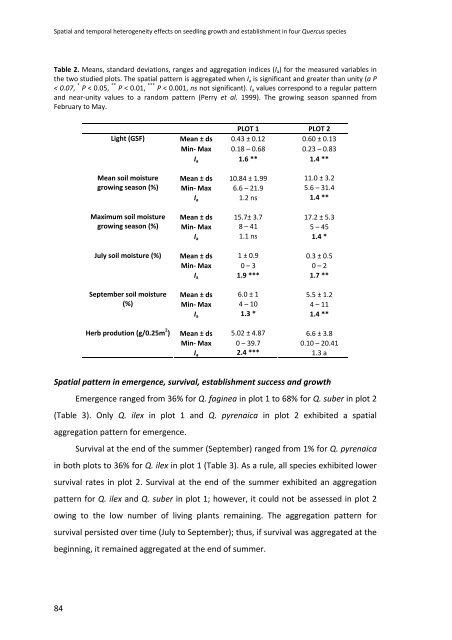
Table 2. Means, standard <strong>de</strong>viations, ranges and aggregation indices (I a ) for the mea<strong>sur</strong>ed variables in<br />
the two studied plots. The spatial pattern is aggregated wh<strong>en</strong> I a is significant and greater than unity (a P<br />
< 0.07, * P < 0.05, ** P < 0.01, *** P < 0.001, ns not significant). I a values correspond to a regu<strong>la</strong>r pattern<br />
and near‐unity values to a random pattern (Perry et al. 1999). The growing season spanned from<br />
February to May.<br />
Light (GSF)<br />
Mean soil moisture<br />
growing season (%)<br />
Maximum soil moisture<br />
growing season (%)<br />
July soil moisture (%)<br />
September soil moisture<br />
(%)<br />
Herb prodution (g/0.25m 2 )<br />
PLOT 1 PLOT 2<br />
Mean ± ds 0.43 ± 0.12 0.60 ± 0.13<br />
Min‐ Max 0.18 – 0.68 0.23 – 0.83<br />
I a 1.6 ** 1.4 **<br />
Mean ± ds 10.84 ± 1.99 11.0 ± 3.2<br />
Min‐ Max 6.6 – 21.9 5.6 – 31.4<br />
I a 1.2 ns 1.4 **<br />
Mean ± ds 15.7± 3.7 17.2 ± 5.3<br />
Min‐ Max 8 – 41 5 – 45<br />
I a 1.1 ns 1.4 *<br />
Mean ± ds 1 ± 0.9 0.3 ± 0.5<br />
Min‐ Max 0 – 3 0 – 2<br />
I a 1.9 *** 1.7 **<br />
Mean ± ds 6.0 ± 1 5.5 ± 1.2<br />
Min‐ Max 4 – 10 4 – 11<br />
I a 1.3 * 1.4 **<br />
Mean ± ds 5.02 ± 4.87 6.6 ± 3.8<br />
Min‐ Max 0 – 39.7 0.10 – 20.41<br />
I a 2.4 *** 1.3 a<br />
Spatial pattern in emerg<strong>en</strong>ce, <strong>sur</strong>vival, establishm<strong>en</strong>t success and growth<br />
Emerg<strong>en</strong>ce ranged from 36% for Q. faginea in plot 1 to 68% for Q. suber in plot 2<br />
(Table 3). Only Q. ilex in plot 1 and Q. pyr<strong>en</strong>aica in plot 2 exhibited a spatial<br />
aggregation pattern for emerg<strong>en</strong>ce.<br />
Survival at the <strong>en</strong>d of the summer (September) ranged from 1% for Q. pyr<strong>en</strong>aica<br />
in both plots to 36% for Q. ilex in plot 1 (Table 3). As a rule, all species exhibited lower<br />
<strong>sur</strong>vival rates in plot 2. Survival at the <strong>en</strong>d of the summer exhibited an aggregation<br />
pattern for Q. ilex and Q. suber in plot 1; however, it could not be assessed in plot 2<br />
owing to the low number of living p<strong>la</strong>nts remaining. The aggregation pattern for<br />
<strong>sur</strong>vival persisted over time (July to September); thus, if <strong>sur</strong>vival was aggregated at the<br />
beginning, it remained aggregated at the <strong>en</strong>d of summer.<br />
84