Establecimiento de cuatro especies de Quercus en el sur de la ...
Establecimiento de cuatro especies de Quercus en el sur de la ...
Establecimiento de cuatro especies de Quercus en el sur de la ...

You also want an ePaper? Increase the reach of your titles
YUMPU automatically turns print PDFs into web optimized ePapers that Google loves.
Capítulo 3<br />
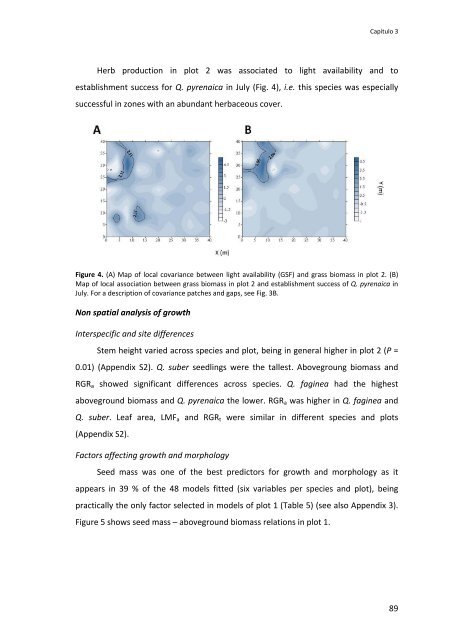
Herb production in plot 2 was associated to light avai<strong>la</strong>bility and to<br />
establishm<strong>en</strong>t success for Q. pyr<strong>en</strong>aica in July (Fig. 4), i.e. this species was especially<br />
successful in zones with an abundant herbaceous cover.<br />
Figure 4. (A) Map of local covariance betwe<strong>en</strong> light avai<strong>la</strong>bility (GSF) and grass biomass in plot 2. (B)<br />
Map of local association betwe<strong>en</strong> grass biomass in plot 2 and establishm<strong>en</strong>t success of Q. pyr<strong>en</strong>aica in<br />
July. For a <strong>de</strong>scription of covariance patches and gaps, see Fig. 3B.<br />
Non spatial analysis of growth<br />
Interspecific and site differ<strong>en</strong>ces<br />
Stem height varied across species and plot, being in g<strong>en</strong>eral higher in plot 2 (P =<br />
0.01) (App<strong>en</strong>dix S2). Q. suber seedlings were the tallest. Abovegroung biomass and<br />
RGR a showed significant differ<strong>en</strong>ces across species. Q. faginea had the highest<br />
aboveground biomass and Q. pyr<strong>en</strong>aica the lower. RGR a was higher in Q. faginea and<br />
Q. suber. Leaf area, LMF a and RGR t were simi<strong>la</strong>r in differ<strong>en</strong>t species and plots<br />
(App<strong>en</strong>dix S2).<br />
Factors affecting growth and morphology<br />
Seed mass was one of the best predictors for growth and morphology as it<br />
appears in 39 % of the 48 mo<strong>de</strong>ls fitted (six variables per species and plot), being<br />
practically the only factor s<strong>el</strong>ected in mo<strong>de</strong>ls of plot 1 (Table 5) (see also App<strong>en</strong>dix 3).<br />
Figure 5 shows seed mass – aboveground biomass r<strong>el</strong>ations in plot 1.<br />
89