Soil water content measured by FDR probes and thresholds for drip irrigation management in peach trees 315of electromagnetic techniques are spreading increasinglybecause they facilitate a rapid, safe, non<strong>de</strong>structive,and easily automated estimation of soil water content.Capacitance probes are relatively inexpensive and easy tooperate. Furthermore, the sensor <strong>de</strong>sign is very adaptable,facilitating the <strong>de</strong>velopment of a variety of configurations(Robinson et al., 1998) and the continuous records bycapacitance probes; provi<strong>de</strong> information about the dynamicvariation of the soil water content due to water application,the soil hydraulic properties, plant water uptake and climatic<strong>de</strong>mand (Starr and Paltineanu, 1998; Goldhamer et al.,1999).The aim of this paper was to study the effect of two irrigationtreatments on the volumetric soil water content and to setthe irrigation management thresholds of the soil water store(SWS) in young early-ripening peach trees. This was assessedby analyzing the dynamic in the variations of soil watercontent, measured in continuous by multisensor capacitanceprobes, based on frequency domain reflectometry (FDR)technique placed within the plant root zone.MATERIAL AND METHODSExperimental siteThe present work was conducted during 2004, from fullbloom to leaf senescence, in an experimental 0.8 ha plotlocated in Santomera-Murcia (Spain): 38º 06’ N, 1º 02’W. The soil is stony and shallow, highly calcareous (56%Calcium carbonate), with a clay-loam texture and low organicmatter content (0.<strong>34</strong>%) and cationic exchange capacity of12.6 meq 100 g -1 , classified as Lithic xeric haploxeroll (SoilSurvey Staff, 1998). The bulk <strong>de</strong>nsity of the soil was 1.45Mg m -3 down to 50 cm, but more compacted (1.67 Mg m -3 )at <strong>de</strong>eper layers. The volumetric soil water content was 0.24cm 3 cm -3 at field capacity (θ FC) and 0.15 cm 3 cm -3 at wiltingpoint (θ WP), as <strong>de</strong>termined in undisturbed soil samples witha matric potential of -0.33 and -15 bar respectively usingthe Richards pressure plate technique, which implied anavailable soil water content of 90 mm m -1 .The plant material consisted of three-year-old peachtrees (Prunus persica L. Batsch) cv. "Flordastar", on GF-677 peach rootstock, planted at 5 x 5 m. The trees wereirrigated by a single lateral line per plant row with four selfcompensatingemitters per tree, spaced at 0.5 m and placed1 m from each si<strong>de</strong> of the trunk, providing 2 L h -1 . Irrigationwas scheduled on the basis of weekly estimated ETc andautomatically controlled by an irrigation programmer an<strong>de</strong>lectro-hydraulic valves. The irrigation water volumes weremeasured with in-line water meters.Agro-meteorological data were recor<strong>de</strong>d by an automatedstation located within the peach orchard. During theexperimental period the average maximum and minimumair temperatures were 30.1 and 7.7 ºC, respectively. Theannual reference evapotranspiration (ETo) <strong>de</strong>termined bythe Penman-Monteith equation (Allen et al., 1998) was 1100 mm, with a maximum of 10 mm day -1 in August. Totalrainfall was 440 mm, from which 245 mm occurred duringthe spring season.TreatmentsTo achieve the objective of this work, two irrigation treatmentswere consi<strong>de</strong>red. In the T1 treatment, the trees were irrigatedto 100% of ETc estimated as reference evapotranspiration(ETo), calculated with the Penman-Monteith methodology(Allen et al., 1998), crop coefficients (Table 1) (Doorenbosand Pruitt, 1986; Fereres and Goldhamer, 1990), and thepercentage of ground area sha<strong>de</strong>d by the tree (Fereres andGoldhamer, 1990). The T2 treatment was irrigated at 50%of the T1 with the same irrigation frequency.Treatments were distributed in a completely randomized<strong>de</strong>sign with four replications, each consisting of one row of13 trees. The central nine trees were used for experimentalmeasurements and the others served as guard trees.Soil and plant measurementsThe volumetric soil water content was continuouslymonitored through the soil profile using multisensorcapacitance probes (Cprobe TM ), based on frequency domainreflectometry (FDR) technique. Two probes per treatmentwere used. Each probe, with four sensors at 0.10, 0.20,0.30 and 0.50 m <strong>de</strong>pth, was installed perpendicular to theemitters’s line and at 10 cm from it, within the wetted area ofthe first emitter of a randomly selected peach tree. An emittergauge was installed to monitor the soil water inputs. Both,the capacitance probe and the rain gauge were connected to aradio transmission unit which registered the average of threemeasurements every 15 min. The multisensor capacitanceprobes were properly installed within the active root systemzone and the soil water distribution by the emitters washighly uniform.
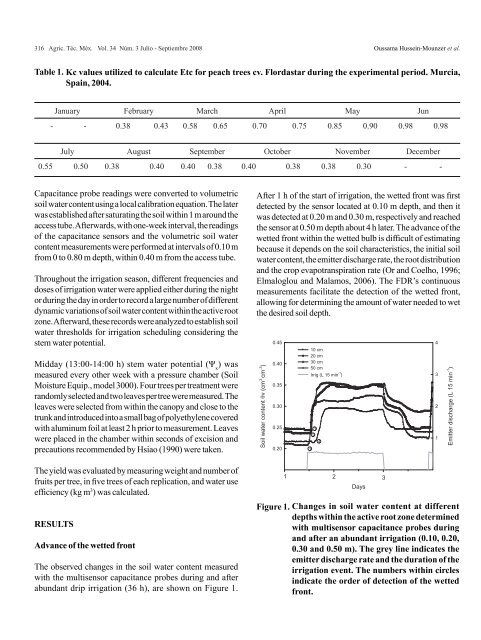
316 Agric. Téc. Méx. <strong>Vol</strong>. <strong>34</strong> Núm. 3 Julio - Septiembre 2008 Oussama Hussein-Mounzer et al.Table 1. Kc values utilized to calculate Etc for peach trees cv. Flordastar during the experimental period. Murcia,Spain, 2004.January February March April May Jun- - 0.38 0.43 0.58 0.65 0.70 0.75 0.85 0.90 0.98 0.98July August September October November December0.55 0.50 0.38 0.40 0.40 0.38 0.40 0.38 0.38 0.30 - -Capacitance probe readings were converted to volumetricsoil water content using a local calibration equation. The laterwas established after saturating the soil within 1 m around theaccess tube. Afterwards, with one-week interval, the readingsof the capacitance sensors and the volumetric soil watercontent measurements were performed at intervals of 0.10 mfrom 0 to 0.80 m <strong>de</strong>pth, within 0.40 m from the access tube.Throughout the irrigation season, different frequencies anddoses of irrigation water were applied either during the nightor during the day in or<strong>de</strong>r to record a large number of differentdynamic variations of soil water content within the active rootzone. Afterward, these records were analyzed to establish soilwater thresholds for irrigation scheduling consi<strong>de</strong>ring thestem water potential.Midday (13:00-14:00 h) stem water potential (Ψ x) wasmeasured every other week with a pressure chamber (SoilMoisture Equip., mo<strong>de</strong>l 3000). Four trees per treatment wererandomly selected and two leaves per tree were measured. Theleaves were selected from within the canopy and close to thetrunk and introduced into a small bag of polyethylene coveredwith aluminum foil at least 2 h prior to measurement. Leaveswere placed in the chamber within seconds of excision andprecautions recommen<strong>de</strong>d by Hsiao (1990) were taken.The yield was evaluated by measuring weight and number offruits per tree, in five trees of each replication, and water useefficiency (kg m 3 ) was calculated.RESULTSAdvance of the wetted frontThe observed changes in the soil water content measuredwith the multisensor capacitance probes during and afterabundant drip irrigation (36 h), are shown on Figure 1.After 1 h of the start of irrigation, the wetted front was first<strong>de</strong>tected by the sensor located at 0.10 m <strong>de</strong>pth, and then itwas <strong>de</strong>tected at 0.20 m and 0.30 m, respectively and reachedthe sensor at 0.50 m <strong>de</strong>pth about 4 h later. The advance of thewetted front within the wetted bulb is difficult of estimatingbecause it <strong>de</strong>pends on the soil characteristics, the initial soilwater content, the emitter discharge rate, the root distributionand the crop evapotranspiration rate (Or and Coelho, 1996;Elmaloglou and Malamos, 2006). The FDR’s continuousmeasurements facilitate the <strong>de</strong>tection of the wetted front,allowing for <strong>de</strong>termining the amount of water nee<strong>de</strong>d to wetthe <strong>de</strong>sired soil <strong>de</strong>pth.Soil water content v (cm 3 cm -3 )0.450.400.350.300.250.2010 cm20 cm30 cm50 cm1Irrig (L 15 min -1 )3241 2 3DaysFigure 1. Changes in soil water content at different<strong>de</strong>pths within the active root zone <strong>de</strong>terminedwith multisensor capacitance probes duringand after an abundant irrigation (0.10, 0.20,0.30 and 0.50 m). The grey line indicates theemitter discharge rate and the duration of theirrigation event. The numbers within circlesindicate the or<strong>de</strong>r of <strong>de</strong>tection of the wettedfront.4321Emitter discharge (L 15 min -1 )