Soil water content measured by FDR probes and thresholds for drip irrigation management in peach trees 317In situ <strong>de</strong>termination of apparent soil water saturation(aSWsat)While irrigation continued, the water content at each soillayer increased progressively up to a constant value whichwas maintained during a long time (more than 24 h) untilirrigation was switch off (Figure 1). At this constant soil watercontent, the soil pores within the volume of influence of thesensors were quasi saturated and the water flow had reacheda steady state (Jury et al., 1991). The repeating pattern ofnearly constant maximal soil water content following severalabundant irrigation events indicated an in situ apparentsoil water saturation (aSWsat). Un<strong>de</strong>r our experimentalconditions the aSWsat for each sensor was about 0.32, 0.35,0.35 and 0.29 cm 3 cm -3 at 0.10, 0.20, 0.30 and 0.50 m <strong>de</strong>pths,respectively. Accordingly, the cumulative soil water contentin the 0-0.50 m soil <strong>de</strong>pth, called soil water store (SWS), was162 mm 0.5 m -1 . The <strong>de</strong>termination of aSWsat helps for theestablishment of irrigation strategies that minimize drainageto <strong>de</strong>eper soil layers (Starr and Paltineanu, 1998).In situ <strong>de</strong>termination of field capacity within the wettedbulb (FC b)After the cessation of irrigation (Figure 1), at midnight of thesecond day, the soil water content <strong>de</strong>creased markedly during2-3 hours due mainly to the redistribution of the gravitationalwater, then soil water content at each sensor <strong>de</strong>pth showeda ten<strong>de</strong>ncy to stabilize at a constant value because the waterredistribution was <strong>de</strong>creasing significantly. The soil watercontent un<strong>de</strong>r these conditions fit well with the conceptof “field capacity” <strong>de</strong>fined as “the amount of water heldin soil after excess water has drained away and the rate ofdownward movement has materially <strong>de</strong>creased” (Veihmeyerand Hendrickson, 1949). Thus, the field capacity values<strong>de</strong>termined for each sensor were 0.26, 0.27, 0.30 and 0.25cm 3 cm -3 at 0.10, 0.20, 0.30 and 0.50 m <strong>de</strong>pth, respectively.The SWS at the 0-0.5 m soil <strong>de</strong>pth at field capacity was 136mm 0.5 m -1 .Plant water uptakeOn the third day, from sunrise until mid afternoon, a rapid<strong>de</strong>crease in the soil water content was <strong>de</strong>tected by the differentcapacitance sensors (Figure 1). However, the magnitu<strong>de</strong> ofthe diurnal soil water loss was more evi<strong>de</strong>nt in the first layer(0.10 m <strong>de</strong>pth), less important in the subsequent soil layersand negligible at the <strong>de</strong>epest one (0.50 m <strong>de</strong>pth), whichindicates the <strong>de</strong>pth of the active root zone as well as theintensity of root water uptake at each soil layer. In general,root <strong>de</strong>velopment un<strong>de</strong>r drip irrigation is constrained to thesoil volume wetted by the emitter, near the soil surface withroot length <strong>de</strong>nsity <strong>de</strong>creasing with <strong>de</strong>pth (Michelakis et al.,1993; Stevens and Douglas, 1994).Thresholds for irrigation schedulingThresholds for irrigation scheduling are practical gui<strong>de</strong> linesto <strong>de</strong>termine the quantity of water and irrigation frequencythat supply the plant needs without producing un<strong>de</strong>siredwater losses. In agreement with the observations above<strong>de</strong>scribed the continuous real time measurements of the soilwater dynamics provi<strong>de</strong>d useful information for irrigationmanagement such as: the advance of the wetted front, theapparent soil water saturation and the <strong>de</strong>pth of the plant activeroot zone. Accordingly, two limits could be established toprecisely <strong>de</strong>termine the dose and frequency of irrigation:- Lower limit or “Refillpoint”; it corresponds to the SWSat which irrigation should be resumed before the plantsun<strong>de</strong>rgo water stress. The amount of water allowed to be<strong>de</strong>pleted from the soil profile before resuming irrigation<strong>de</strong>pends, among others aspects, on the crop, the cultivar, thephenological stage and on the intensity of the evaporative<strong>de</strong>mand. For these reasons, exhaustive local studies shouldbe carried out to <strong>de</strong>termine the manageable allowable <strong>de</strong>ficitfor each crop. A refillpoint” equal to 90% of the field capacitymight be practical for nearly all crops as it is equivalent to amanageable allowable <strong>de</strong>ficit lower than most of the valuesrecommen<strong>de</strong>d by FAO (Allen et al., 1998).- Upper limit or “fullpoint”, which corresponds to the SWSvalue recor<strong>de</strong>d when the wetted front reaches the bottom ofthe active root zone during a nightly irrigation event. Thatcorresponds roughly to water content between aSWsat andFC b. This may lead to <strong>de</strong>creasing percolation of water beneaththe active root zone in excess of any required leaching forsalinity management.Therefore, the irrigation dose is related to the time nee<strong>de</strong>dto raise the SWS from the refillpoint up to the fullpoint,whereas the irrigation frequency is <strong>de</strong>termined by the effectof the evaporative <strong>de</strong>mand (ETc) to <strong>de</strong>plete the SWS fromthe fullpoint down to the refillpoint.The dynamic of the SWS consi<strong>de</strong>ring several irrigation eventsis shown on Figure 2. The SWS represents the cumulativewater content within the active root zone (0-0.50 m <strong>de</strong>pth)
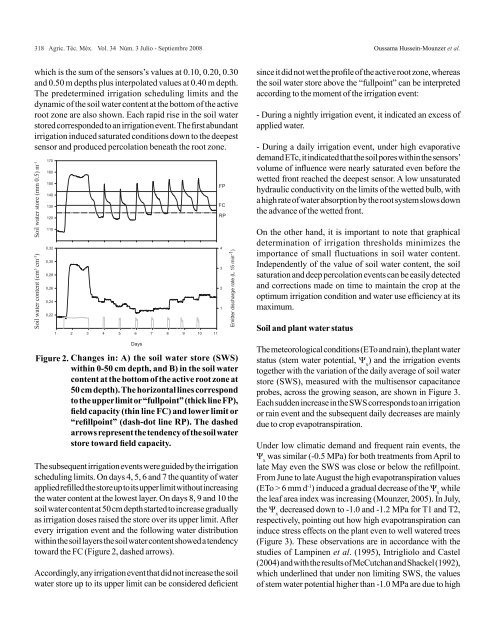
318 Agric. Téc. Méx. <strong>Vol</strong>. <strong>34</strong> Núm. 3 Julio - Septiembre 2008 Oussama Hussein-Mounzer et al.which is the sum of the sensors’s values at 0.10, 0.20, 0.30and 0.50 m <strong>de</strong>pths plus interpolated values at 0.40 m <strong>de</strong>pth.The pre<strong>de</strong>termined irrigation scheduling limits and thedynamic of the soil water content at the bottom of the activeroot zone are also shown. Each rapid rise in the soil waterstored correspon<strong>de</strong>d to an irrigation event. The first abundantirrigation induced saturated conditions down to the <strong>de</strong>epestsensor and produced percolation beneath the root zone.Soil water content (cm 3 cm -3 ) Soil water store (mm 0.5) m -11701601501401301201100,320,300,280,260,240,221 2 3 4 5 6 7 8 9 10 11DaysFigure 2. Changes in: A) the soil water store (SWS)within 0-50 cm <strong>de</strong>pth, and B) in the soil watercontent at the bottom of the active root zone at50 cm <strong>de</strong>pth). The horizontal lines correspondto the upper limit or “fullpoint” (thick line FP),field capacity (thin line FC) and lower limit or“refillpoint” (dash-dot line RP). The dashedarrows represent the ten<strong>de</strong>ncy of the soil waterstore toward field capacity.The subsequent irrigation events were gui<strong>de</strong>d by the irrigationscheduling limits. On days 4, 5, 6 and 7 the quantity of waterapplied refilled the store up to its upper limit without increasingthe water content at the lowest layer. On days 8, 9 and 10 thesoil water content at 50 cm <strong>de</strong>pth started to increase graduallyas irrigation doses raised the store over its upper limit. Afterevery irrigation event and the following water distributionwithin the soil layers the soil water content showed a ten<strong>de</strong>ncytoward the FC (Figure 2, dashed arrows).Accordingly, any irrigation event that did not increase the soilwater store up to its upper limit can be consi<strong>de</strong>red <strong>de</strong>ficientFPFCRP4321Emitter discharge rate (L 15 min -1 )since it did not wet the profile of the active root zone, whereasthe soil water store above the “fullpoint” can be interpretedaccording to the moment of the irrigation event:- During a nightly irrigation event, it indicated an excess ofapplied water.- During a daily irrigation event, un<strong>de</strong>r high evaporative<strong>de</strong>mand ETc, it indicated that the soil pores within the sensors’volume of influence were nearly saturated even before thewetted front reached the <strong>de</strong>epest sensor. A low unsaturatedhydraulic conductivity on the limits of the wetted bulb, witha high rate of water absorption by the root system slows downthe advance of the wetted front.On the other hand, it is important to note that graphical<strong>de</strong>termination of irrigation thresholds minimizes theimportance of small fluctuations in soil water content.In<strong>de</strong>pen<strong>de</strong>ntly of the value of soil water content, the soilsaturation and <strong>de</strong>ep percolation events can be easily <strong>de</strong>tectedand corrections ma<strong>de</strong> on time to maintain the crop at theoptimum irrigation condition and water use efficiency at itsmaximum.Soil and plant water statusThe meteorological conditions (ETo and rain), the plant waterstatus (stem water potential, Ψ x) and the irrigation eventstogether with the variation of the daily average of soil waterstore (SWS), measured with the multisensor capacitanceprobes, across the growing season, are shown in Figure 3.Each sud<strong>de</strong>n increase in the SWS corresponds to an irrigationor rain event and the subsequent daily <strong>de</strong>creases are mainlydue to crop evapotranspiration.Un<strong>de</strong>r low climatic <strong>de</strong>mand and frequent rain events, theΨ xwas similar (-0.5 MPa) for both treatments from April tolate May even the SWS was close or below the refillpoint.From June to late August the high evapotranspiration values(ETo > 6 mm d -1 ) induced a gradual <strong>de</strong>crease of the Ψ xwhilethe leaf area in<strong>de</strong>x was increasing (Mounzer, 2005). In July,the Ψ x<strong>de</strong>creased down to -1.0 and -1.2 MPa for T1 and T2,respectively, pointing out how high evapotranspiration caninduce stress effects on the plant even to well watered trees(Figure 3). These observations are in accordance with thestudies of Lampinen et al. (1995), Intrigliolo and Castel(2004) and with the results of McCutchan and Shackel (1992),which un<strong>de</strong>rlined that un<strong>de</strong>r non limiting SWS, the valuesof stem water potential higher than -1.0 MPa are due to high