Efecto <strong>de</strong>l tamaño <strong>de</strong> partícula sobre algunas propieda<strong>de</strong>s físicas <strong>de</strong>l Tezontle <strong>de</strong> Guanajuato, México 325Las muestras se colectaron <strong>de</strong>spués <strong>de</strong> cribadas en malla <strong>de</strong>2 cm (¾ pulgada). En cada sitio se tomaron diez submuestrasen forma aleatoria <strong>de</strong> la pila comercial <strong>de</strong> producción, lascuales fueron mezcladas y el volumen final fue reducido a30 L por el método <strong>de</strong> cuarteo.El contenido <strong>de</strong> humedad en las muestras fue muy variable,<strong>de</strong>bido a que el material estaba a la intemperie, por lo quetodas las muestras fueron secadas a 35 ºC durante 5 días enuna estufa con circulación <strong>de</strong> aire forzado. Una vez secas,se tamizaron <strong>de</strong> acuerdo con la metodología <strong>de</strong>scrita porMartínez (1993). Para la separación granulométrica seemplearon tamices <strong>de</strong> 0.125, 0.25, 0.50, 0.71, 1.0, 2.0, 4.0,6.5, 8.5 y 12.6 mm y un tamizador Tyler (Rotap).A cada una <strong>de</strong> las fracciones obtenidas se <strong>de</strong>terminó: 1)<strong>de</strong>nsidad aparente (Da) mediante el método <strong>de</strong>scrito en laNorma Europea UNE-EN 13040:1999, 2) <strong>de</strong>nsidad real (Dr)por el método <strong>de</strong>l picnómetro <strong>de</strong> agua (Blake y Hartge, 1986)en muestras inalteradas y pulverizadas y, 3) espacio porosototal (EPT) en muestras pulverizadas y porosidad efectiva(P e) en muestras inalterada por la Norma Europea UNE EN13041:1999. La porosidad ocluida (P o) se <strong>de</strong>terminó <strong>de</strong> ladiferencia entre el EPT y la P e; 4) capacidad <strong>de</strong> aireación(CA) y capacidad <strong>de</strong> retención <strong>de</strong> humedad (CRH), por elmétodo <strong>de</strong>scrito por Ansorena (1994).Debido a que la mas alta variación <strong>de</strong> la capacidad <strong>de</strong>aireación y la retención <strong>de</strong> humedad se ha observado en elrango <strong>de</strong> 0.5 a 1 mm <strong>de</strong> diámetro <strong>de</strong> partícula, se incluyó unvalor intermedio 0.71 mm con la finalidad <strong>de</strong> reducir el rangoy <strong>de</strong>terminar el efecto con precisión. Las partículas mayores<strong>de</strong> 12.6 mm no se analizaron <strong>de</strong>bido a que las muestraspresentaron un porcentaje menor <strong>de</strong> 2% en peso.Todas las <strong>de</strong>terminaciones se realizaron con cuatrorepeticiones y los resultados fueron sujetos a un análisis <strong>de</strong>varianza (ANOVA) y la comparación <strong>de</strong> medias se realizópor la prueba <strong>de</strong> Tukey (p≤0.05) mediante el paqueteestadístico SAS v 8.2. (SAS, 1999).RESULTADOS Y DISCUSIÓNDensidad aparenteSe observó diferencia significativa entre tamaños <strong>de</strong> partículay entre muestras para un mismo tamaño para <strong>de</strong>nsidadaparente (Da). De manera general, las muestras <strong>de</strong>Mina, Emenguaro y San Juan, fueron las <strong>de</strong> menor valormedio (0.67, 0.62 y 0.73 g cm -3 , respectivamente) (Cuadro1). Estos tezontles son más ligeros y porosos lo que facilitasu manejo (llenado y acarreo <strong>de</strong> macetas), cualidad<strong>de</strong>stacada por Baca et al. (1990) en tezontle rojo y negro.Por otra parte, al disminuir el tamaño <strong>de</strong> partícula la Da seincrementó en forma similar a lo observado por Nogueraet al. (2003) en polvo <strong>de</strong> coco y por Wallach et al. (1992)en tezontle rojo en Israel. Las fracciones mayores <strong>de</strong> 4mm, no fueron diferentes entre ellas en la mayoría <strong>de</strong> lasmuestras. Los valores <strong>de</strong> Da observados fueron similaresa los reportados por Raviv et al. (2002) con valores <strong>de</strong> 0.8a 1.5 g cm -3 para tezontles (muestra compuesta) <strong>de</strong> Israel.Destaca la variación que pue<strong>de</strong> existir entre orígenes <strong>de</strong>lmaterial, en cuanto a esta variable, pues los yacimientos<strong>de</strong> V. Hermosa y Peñitas presentaron, en todas fraccionesgranulométricas la mayor <strong>de</strong>nsidad aparente.Densidad realSe observó diferencia significativa entre las fraccionesgranulométricas en cada muestra, así como entre muestras(Cuadro 2). En forma general, a medida que se incrementóel tamaño <strong>de</strong> partícula, se redujo la <strong>de</strong>nsidad real (Dr). Lostezontles <strong>de</strong> los yacimientos <strong>de</strong> Mina, Emeguaro y Tepamepresentaron el menor valor medio <strong>de</strong> Dr con valores <strong>de</strong> 2.20,2.23 y 2.39 g cm -3 , respectivamente, caso contrario a V.Hermosa con valores <strong>de</strong> 2.81 seguido <strong>de</strong> Peñitas, con 2.58 gcm -3 . No se observó diferencia estadística entre las fraccionesmenores a 0.25 mm para esta característica en la mayoría <strong>de</strong>las muestras a excepción <strong>de</strong> V. Hermosa y San Juan, al igualque para las fracciones <strong>de</strong> más <strong>de</strong> 6.50 mm no se observódiferencia estadística en la mayoría <strong>de</strong> las muestras.Capacidad <strong>de</strong> aireaciónLos valores <strong>de</strong> la capacidad <strong>de</strong> aireación (CA) <strong>de</strong> las seismuestras <strong>de</strong> tezontle, presentaron diferencia estadística entrelas diferentes fracciones granulométricas para cada muestra.A medida que disminuyó el tamaño <strong>de</strong> partícula la CA seredujo en todas las muestras, (Cuadro 3). Es importanteseñalar que para fracciones mayores <strong>de</strong> 4.00 mm, no seobservó diferencia estadística significativa al igual que paralas fracciones menores <strong>de</strong> 0.50 mm.Se observó una disminución significativa <strong>de</strong> la CA a partir<strong>de</strong> la fracción <strong>de</strong> 0.71-1.00 mm. En la fracción <strong>de</strong> 0.25-0.50mm, disminuyó casi 50% respecto a las fracciones <strong>de</strong> 0.50-0.71 y 0.25-0.50 mm, por lo que es importante <strong>de</strong>stacar que la
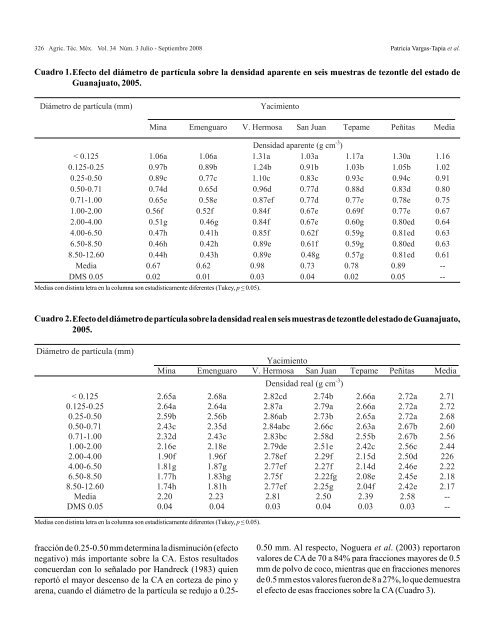
326 Agric. Téc. Méx. <strong>Vol</strong>. <strong>34</strong> Núm. 3 Julio - Septiembre 2008 Patricia Vargas-Tapia et al.Cuadro 1.Efecto <strong>de</strong>l diámetro <strong>de</strong> partícula sobre la <strong>de</strong>nsidad aparente en seis muestras <strong>de</strong> tezontle <strong>de</strong>l estado <strong>de</strong>Guanajuato, 2005.Diámetro <strong>de</strong> partícula (mm)YacimientoMina Emenguaro V. Hermosa San Juan Tepame Peñitas MediaDensidad aparente (g cm -3 )< 0.125 1.06a 1.06a 1.31a 1.03a 1.17a 1.30a 1.160.125-0.25 0.97b 0.89b 1.24b 0.91b 1.03b 1.05b 1.020.25-0.50 0.89c 0.77c 1.10c 0.83c 0.93c 0.94c 0.910.50-0.71 0.74d 0.65d 0.96d 0.77d 0.88d 0.83d 0.800.71-1.00 0.65e 0.58e 0.87ef 0.77d 0.77e 0.78e 0.751.00-2.00 0.56f 0.52f 0.84f 0.67e 0.69f 0.77e 0.672.00-4.00 0.51g 0.46g 0.84f 0.67e 0.60g 0.80ed 0.644.00-6.50 0.47h 0.41h 0.85f 0.62f 0.59g 0.81ed 0.636.50-8.50 0.46h 0.42h 0.89e 0.61f 0.59g 0.80ed 0.638.50-12.60 0.44h 0.43h 0.89e 0.48g 0.57g 0.81ed 0.61Media 0.67 0.62 0.98 0.73 0.78 0.89 --DMS 0.05 0.02 0.01 0.03 0.04 0.02 0.05 --Medias con distinta letra en la columna son estadísticamente diferentes (Tukey, p ≤ 0.05).Cuadro 2.Efecto <strong>de</strong>l diámetro <strong>de</strong> partícula sobre la <strong>de</strong>nsidad real en seis muestras <strong>de</strong> tezontle <strong>de</strong>l estado <strong>de</strong> Guanajuato,2005.Diámetro <strong>de</strong> partícula (mm)YacimientoMina Emenguaro V. Hermosa San Juan Tepame Peñitas MediaDensidad real (g cm -3 )< 0.125 2.65a 2.68a 2.82cd 2.74b 2.66a 2.72a 2.710.125-0.25 2.64a 2.64a 2.87a 2.79a 2.66a 2.72a 2.720.25-0.50 2.59b 2.56b 2.86ab 2.73b 2.65a 2.72a 2.680.50-0.71 2.43c 2.35d 2.84abc 2.66c 2.63a 2.67b 2.600.71-1.00 2.32d 2.43c 2.83bc 2.58d 2.55b 2.67b 2.561.00-2.00 2.16e 2.18e 2.79<strong>de</strong> 2.51e 2.42c 2.56c 2.442.00-4.00 1.90f 1.96f 2.78ef 2.29f 2.15d 2.50d 2264.00-6.50 1.81g 1.87g 2.77ef 2.27f 2.14d 2.46e 2.226.50-8.50 1.77h 1.83hg 2.75f 2.22fg 2.08e 2.45e 2.188.50-12.60 1.74h 1.81h 2.77ef 2.25g 2.04f 2.42e 2.17Media 2.20 2.23 2.81 2.50 2.39 2.58 --DMS 0.05 0.04 0.04 0.03 0.04 0.03 0.03 --Medias con distinta letra en la columna son estadísticamente diferentes (Tukey, p ≤ 0.05).fracción <strong>de</strong> 0.25-0.50 mm <strong>de</strong>termina la disminución (efectonegativo) más importante sobre la CA. Estos resultadosconcuerdan con lo señalado por Handreck (1983) quienreportó el mayor <strong>de</strong>scenso <strong>de</strong> la CA en corteza <strong>de</strong> pino yarena, cuando el diámetro <strong>de</strong> la partícula se redujo a 0.25-0.50 mm. Al respecto, Noguera et al. (2003) reportaronvalores <strong>de</strong> CA <strong>de</strong> 70 a 84% para fracciones mayores <strong>de</strong> 0.5mm <strong>de</strong> polvo <strong>de</strong> coco, mientras que en fracciones menores<strong>de</strong> 0.5 mm estos valores fueron <strong>de</strong> 8 a 27%, lo que <strong>de</strong>muestrael efecto <strong>de</strong> esas fracciones sobre la CA (Cuadro 3).