Vol. 34 Núm. 3 - Instituto Nacional de Investigaciones Forestales ...
Vol. 34 Núm. 3 - Instituto Nacional de Investigaciones Forestales ...
Vol. 34 Núm. 3 - Instituto Nacional de Investigaciones Forestales ...
Create successful ePaper yourself
Turn your PDF publications into a flip-book with our unique Google optimized e-Paper software.
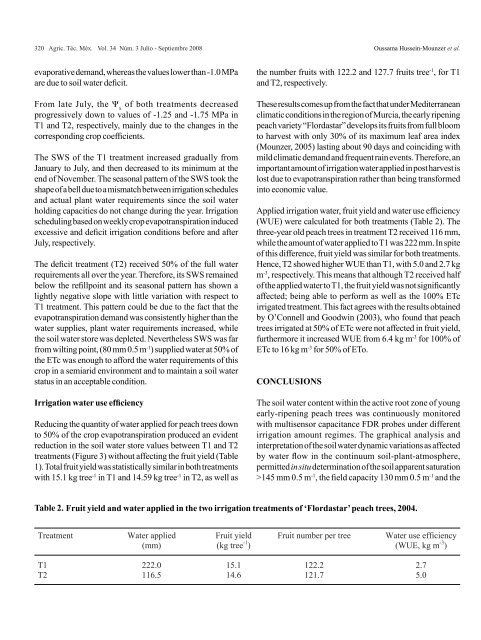
320 Agric. Téc. Méx. <strong>Vol</strong>. <strong>34</strong> Núm. 3 Julio - Septiembre 2008 Oussama Hussein-Mounzer et al.evaporative <strong>de</strong>mand, whereas the values lower than -1.0 MPaare due to soil water <strong>de</strong>ficit.From late July, the Ψ xof both treatments <strong>de</strong>creasedprogressively down to values of -1.25 and -1.75 MPa inT1 and T2, respectively, mainly due to the changes in thecorresponding crop coefficients.The SWS of the T1 treatment increased gradually fromJanuary to July, and then <strong>de</strong>creased to its minimum at theend of November. The seasonal pattern of the SWS took theshape of a bell due to a mismatch between irrigation schedulesand actual plant water requirements since the soil waterholding capacities do not change during the year. Irrigationscheduling based on weekly crop evapotranspiration induce<strong>de</strong>xcessive and <strong>de</strong>ficit irrigation conditions before and afterJuly, respectively.The <strong>de</strong>ficit treatment (T2) received 50% of the full waterrequirements all over the year. Therefore, its SWS remainedbelow the refillpoint and its seasonal pattern has shown alightly negative slope with little variation with respect toT1 treatment. This pattern could be due to the fact that theevapotranspiration <strong>de</strong>mand was consistently higher than thewater supplies, plant water requirements increased, whilethe soil water store was <strong>de</strong>pleted. Nevertheless SWS was farfrom wilting point, (80 mm 0.5 m -1 ) supplied water at 50% ofthe ETc was enough to afford the water requirements of thiscrop in a semiarid environment and to maintain a soil waterstatus in an acceptable condition.Irrigation water use efficiencyReducing the quantity of water applied for peach trees downto 50% of the crop evapotranspiration produced an evi<strong>de</strong>ntreduction in the soil water store values between T1 and T2treatments (Figure 3) without affecting the fruit yield (Table1). Total fruit yield was statistically similar in both treatmentswith 15.1 kg tree -1 in T1 and 14.59 kg tree -1 in T2, as well asthe number fruits with 122.2 and 127.7 fruits tree -1 , for T1and T2, respectively.These results comes up from the fact that un<strong>de</strong>r Mediterraneanclimatic conditions in the region of Murcia, the early ripeningpeach variety “Flordastar” <strong>de</strong>velops its fruits from full bloomto harvest with only 30% of its maximum leaf area in<strong>de</strong>x(Mounzer, 2005) lasting about 90 days and coinciding withmild climatic <strong>de</strong>mand and frequent rain events. Therefore, animportant amount of irrigation water applied in post harvest islost due to evapotranspiration rather than being transformedinto economic value.Applied irrigation water, fruit yield and water use efficiency(WUE) were calculated for both treatments (Table 2). Thethree-year old peach trees in treatment T2 received 116 mm,while the amount of water applied to T1 was 222 mm. In spiteof this difference, fruit yield was similar for both treatments.Hence, T2 showed higher WUE than T1, with 5.0 and 2.7 kgm -3 , respectively. This means that although T2 received halfof the applied water to T1, the fruit yield was not significantlyaffected; being able to perform as well as the 100% ETcirrigated treatment. This fact agrees with the results obtainedby O’Connell and Goodwin (2003), who found that peachtrees irrigated at 50% of ETc were not affected in fruit yield,furthermore it increased WUE from 6.4 kg m -3 for 100% ofETc to 16 kg m -3 for 50% of ETo.CONCLUSIONSThe soil water content within the active root zone of youngearly-ripening peach trees was continuously monitoredwith multisensor capacitance FDR probes un<strong>de</strong>r differentirrigation amount regimes. The graphical analysis andinterpretation of the soil water dynamic variations as affectedby water flow in the continuum soil-plant-atmosphere,permitted in situ <strong>de</strong>termination of the soil apparent saturation>145 mm 0.5 m -1 , the field capacity 130 mm 0.5 m -1 and theTable 2. Fruit yield and water applied in the two irrigation treatments of ‘Flordastar’ peach trees, 2004.TreatmentWater applied(mm)Fruit yield(kg tree -1 )Fruit number per treeWater use efficiency(WUE, kg m -3 )T1 222.0 15.1 122.2 2.7T2 116.5 14.6 121.7 5.0


