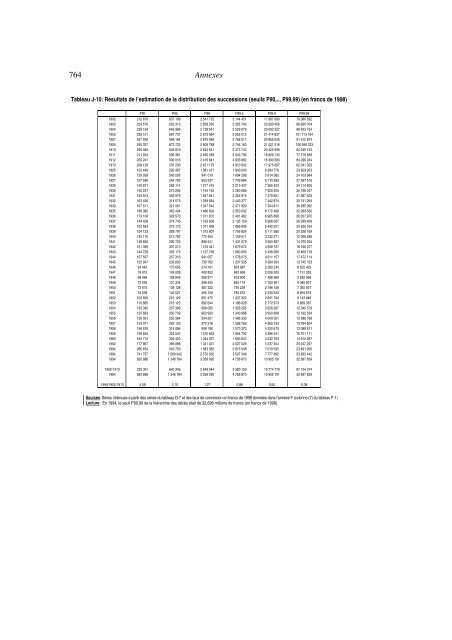
764 Annexes Tableau J-10: Résultats de l’estimation de la distribution des successions (seuils P90,.., P99,99) (en francs de 1998) P90 P95 P99 P99,5 P99,9 P99,99 1902 212 678 637 108 2 541 712 5 144 451 17 987 689 76 086 592 1903 224 576 652 313 2 658 305 5 395 709 20 260 456 68 630 704 1904 228 194 646 986 2 738 541 5 529 979 20 083 327 98 953 734 1905 238 101 667 737 2 873 994 5 855 012 21 414 837 101 713 164 1907 247 938 699 164 2 875 089 5 768 011 20 855 545 91 612 874 1909 245 337 673 733 2 809 788 5 746 163 21 521 516 106 580 333 1910 226 485 648 819 2 643 641 5 473 743 20 425 999 84 249 123 1911 211 934 596 381 2 490 358 5 043 796 18 829 135 77 179 638 1912 209 241 590 016 2 416 841 4 933 882 18 393 580 84 296 244 1913 209 126 591 200 2 451 170 4 910 842 17 975 697 82 041 329 1925 152 449 292 487 1 081 471 1 943 640 6 284 776 23 929 303 1926 129 039 245 295 941 019 1 694 299 5 814 382 24 703 984 1927 127 580 244 795 953 537 1 749 684 6 110 583 27 697 516 1929 140 871 269 114 1 217 415 2 213 437 7 365 423 34 114 606 1930 140 237 273 256 1 194 155 2 260 086 7 600 255 35 168 047 1931 155 913 302 979 1 247 041 2 352 916 7 279 851 31 387 403 1932 163 426 314 575 1 339 684 2 443 377 7 442 874 32 741 264 1933 167 511 321 061 1 347 542 2 471 829 7 354 811 38 285 092 1935 189 082 362 404 1 486 604 2 650 092 8 172 486 32 289 560 1936 173 100 328 570 1 311 872 2 401 462 6 985 808 26 007 972 1937 144 428 274 745 1 163 908 2 135 129 5 966 057 26 289 409 1938 163 653 275 173 1 071 469 1 866 806 5 492 521 20 630 164 1939 154 123 258 797 1 015 807 1 756 824 5 111 565 20 528 169 1940 135 110 213 792 775 455 1 159 611 3 232 271 12 056 626 1941 148 820 290 723 886 541 1 431 079 3 950 567 14 070 034 1942 151 399 307 013 1 103 441 1 679 674 4 648 137 16 166 377 1943 144 728 302 179 1 127 758 1 960 836 5 436 666 19 469 718 1944 157 597 257 316 941 057 1 578 075 4 611 157 17 472 114 1945 125 947 233 800 739 762 1 207 935 3 394 934 12 745 763 1946 94 443 173 656 574 161 853 987 2 280 234 8 525 423 1947 79 812 149 228 492 852 842 669 2 026 505 7 131 053 1948 68 084 108 846 366 971 612 900 1 486 580 5 262 066 1949 72 055 131 334 398 425 652 119 1 702 991 6 085 807 1950 72 674 139 128 487 322 740 239 2 196 106 7 365 927 1951 72 238 140 521 495 159 784 672 2 230 543 8 934 679 1952 103 829 201 129 651 475 1 037 322 2 641 794 9 143 848 1953 110 865 216 125 692 644 1 186 028 2 772 973 9 969 367 1954 130 340 257 396 898 065 1 328 295 3 626 287 12 340 579 1955 125 693 250 739 903 920 1 340 988 3 950 898 12 192 534 1956 126 091 253 384 934 551 1 466 333 4 000 051 12 996 768 1957 153 071 252 123 972 516 1 588 765 4 265 133 13 764 604 1958 156 576 314 086 958 186 1 570 373 4 320 679 13 089 911 1959 159 643 325 547 1 010 663 1 654 792 4 396 241 16 701 111 1960 163 712 339 450 1 034 037 1 663 647 4 532 703 14 612 287 1962 177 967 385 888 1 341 421 2 027 029 5 337 454 20 047 297 1964 286 654 543 703 1 683 382 2 815 548 7 019 535 23 491 930 1984 741 757 1 069 942 2 570 062 3 597 349 7 777 692 23 833 442 1994 920 686 1 346 784 3 358 095 4 758 870 10 905 191 32 697 839 1902-1913 225 361 640 346 2 649 944 5 380 159 19 774 778 87 134 374 1994 920 686 1 346 784 3 358 095 4 758 870 10 905 191 32 697 839 1994/1902-1913 4,09 2,10 1,27 0,88 0,55 0,38 Sources: Séries obtenues à partir des séries du tableau G-7 et des taux de conversion en francs de 1998 données dans l’annexe F (colonne (7) du tableau F-1) Lecture : En 1994, le seuil P99,99 de la hiérarchie des décès était de 32,698 millions de francs (en francs de 1998).
Annexe J 765 Tableau J-11: Résultats de l’estimation des parts des grosses successions dans l’annuité successorale totale (parts P90-100,.., P99,99-100) (en %) P90-100 P95-100 P99-100 P99,5-100 P99,9-100 P99,99-100 1902 82,69 73,59 50,13 40,15 22,04 7,32 1903 84,94 76,54 53,02 42,84 23,31 7,91 1904 86,33 78,81 56,67 46,96 28,72 13,46 1905 86,58 78,91 57,91 48,49 30,27 15,08 1907 83,93 75,14 51,72 41,44 21,92 7,11 1909 85,01 76,62 54,65 44,63 25,89 10,21 1910 85,02 76,41 53,15 42,67 22,97 8,33 1911 86,00 77,81 55,74 45,94 26,96 11,93 1912 86,08 77,81 55,97 46,44 28,05 12,66 1913 85,18 76,66 53,62 43,60 25,08 9,88 1925 77,37 66,32 42,48 34,05 18,01 6,28 1926 77,17 66,35 43,04 35,05 19,90 7,12 1927 78,99 68,44 46,06 37,67 21,86 8,56 1929 78,74 68,80 47,39 39,10 22,99 9,78 1930 80,24 70,28 49,14 40,72 24,14 9,78 1931 77,53 66,87 44,49 36,28 20,39 7,45 1932 77,09 66,17 43,14 34,91 19,39 7,86 1933 77,21 66,27 43,06 34,76 19,17 6,23 1935 76,80 66,28 44,12 36,11 21,46 10,70 1936 76,76 66,20 44,19 36,51 22,20 11,74 1937 75,63 64,59 41,13 33,02 18,09 7,54 1938 74,92 62,99 40,24 32,54 19,03 9,25 1939 77,07 64,71 41,55 33,56 19,70 9,67 1940 74,42 58,88 34,41 25,73 13,51 5,32 1941 71,53 58,37 32,64 24,77 12,27 3,77 1942 72,88 59,74 34,59 26,33 13,14 4,18 1943 74,98 61,63 35,62 27,09 12,89 3,67 1944 75,84 61,91 36,16 27,88 14,04 4,50 1945 73,78 60,16 34,04 25,89 12,86 4,31 1946 72,68 58,02 31,72 23,59 11,36 3,31 1947 71,65 57,04 31,02 23,78 11,44 3,43 1948 73,66 58,88 31,74 23,83 11,56 3,55 1949 73,49 59,25 33,91 24,20 12,64 3,40 1950 75,35 61,04 34,29 26,04 13,05 4,24 1951 76,26 62,62 37,01 29,33 16,43 8,15 1952 75,28 60,78 33,00 24,37 11,72 3,26 1953 75,36 60,43 32,26 23,97 11,21 3,66 1954 74,00 59,11 31,22 23,09 11,26 3,50 1955 76,80 61,93 33,23 24,65 11,69 3,38 1956 93,76 75,91 40,92 30,51 14,79 4,41 1957 92,25 75,97 42,58 32,07 15,54 5,17 1958 87,15 70,52 38,74 28,75 13,26 3,80 1959 86,77 70,38 39,58 29,64 15,05 5,22 1960 86,37 69,27 37,74 27,88 13,16 3,68 1962 81,23 65,36 35,83 27,07 13,78 4,59 1964 82,00 66,24 35,96 26,52 12,53 4,19 1984 60,12 43,36 19,07 13,35 5,83 1,83 1994 54,87 40,13 17,53 12,29 5,20 1,56 1902-1913 85,18 76,83 54,26 44,32 25,52 10,39 1994 54,87 40,13 17,53 12,29 5,20 1,56 Sources: Séries obtenues à partir des séries du tableau G-5 et des annuités successorales indiquées sur le tableau J-1 (lignes « total ») Lecture : En 1994, la part du fractile P99, 99-100 de la hiérarchie des décès dans l’annuité successorale totale était de 1,56 %.
- Page 1 and 2:
LES HAUTS REVENUS EN FRANCE AU XX e
- Page 3 and 4:
THOMAS PIKETTY LES HAUTS REVENUS EN
- Page 5:
SOMMAIRE Remerciements . . . . . .
- Page 9 and 10:
ANNEXE A Les tableaux statistiques
- Page 11 and 12:
Annexe A 557 1935 1936 1937 1938 Ta
- Page 13 and 14:
Annexe A 559 1971 1972 1973 1974 Ta
- Page 15 and 16:
Annexe A 561 de la tranche de reven
- Page 17 and 18:
Annexe A 563 effectivement été im
- Page 19 and 20:
Annexe A 565 toutes les autres majo
- Page 21 and 22:
Annexe A 567 Tableau A-2 (suite et
- Page 23 and 24:
Annexe A 569 tableaux « répartiti
- Page 25 and 26:
Annexe A 571 Ces publications du mi
- Page 27 and 28:
Annexe A 573 tulés « Les impôts
- Page 29 and 30:
Annexe A 575 Tableau A-6: Le rythme
- Page 31 and 32:
Annexe A 577 Tableau A-7 : Le monta
- Page 33 and 34:
Annexe A 579 1936 était de 1,342 m
- Page 35 and 36:
Annexe A 581 Tableau A-9: Le cas de
- Page 37 and 38:
Annexe A 583 millions de francs de
- Page 39 and 40:
Annexe A 585 (v) Nous avons regroup
- Page 41 and 42:
Annexe A 587 France », « revenus
- Page 43 and 44:
Annexe A 589 Commençons par les ta
- Page 45 and 46:
Annexe A 591 La suppression en 1959
- Page 47 and 48:
Annexe B 593 (P90-95 est le revenu
- Page 49 and 50:
Annexe B 595 Tableau B-1: Les coeff
- Page 51 and 52:
Annexe B 597 1965 1966 1967 1968 19
- Page 53 and 54:
Annexe B 599 plus bas peuvent être
- Page 55 and 56:
Annexe B 601 comparées aux fluctua
- Page 57 and 58:
Annexe B 603 Tableau B-2 (suite et
- Page 59 and 60:
Annexe B 605 Tableau B-4 (suite et
- Page 61 and 62:
Annexe B 607 foyers dont le revenu
- Page 63 and 64:
Annexe B 609 Tableau B-5: Les taux
- Page 65 and 66:
Annexe B 611 Tableau B-6: Les taux
- Page 67 and 68:
Annexe B 613 Tableau B-8 (suite et
- Page 69 and 70:
Annexe B 615 Tableau B-10: Résulta
- Page 71 and 72:
Annexe B 617 Tableau B-11 (suite et
- Page 73 and 74:
Annexe B 619 Tableau B-13 (suite et
- Page 75 and 76:
Annexe B 621 Tableau B-14 (suite et
- Page 77 and 78:
Annexe B 623 période). Il est donc
- Page 79 and 80:
Annexe B 625 Tableau B-16: Les rés
- Page 81 and 82:
Annexe B 627 Tableau B-16 (suite) 1
- Page 83 and 84:
Annexe B 629 Les tableaux B-17 et B
- Page 85 and 86:
Annexe B 631 P99-99,5 P99,5-99,9 P9
- Page 87 and 88:
Annexe B 633 P99,9-100 P99,99-100 P
- Page 89 and 90:
Annexe B 635 des différents fracti
- Page 91 and 92:
Annexe B 637 Tableau B-20 (suite et
- Page 93 and 94:
Annexe B 639 (pour le revenu imposa
- Page 95 and 96:
Annexe B 641 Tableau B-22 (suite et
- Page 97 and 98:
Annexe B 643 estimations des taux m
- Page 99 and 100:
Annexe B 645 marges d’erreur maxi
- Page 101 and 102:
ANNEXE C Données complémentaires
- Page 103 and 104:
Annexe C 649 Tableau C-3 : Les plaf
- Page 105 and 106:
Annexe C 651 Tableau C-6: Les barè
- Page 107 and 108:
2. CHRONOLOGIE DES PRINCIPAUX TEXTE
- Page 109 and 110:
Annexe C 655 Loi du 12/7/1965 : cr
- Page 111 and 112:
ANNEXE D Données brutes, méthodol
- Page 113 and 114:
Annexe D 659 Tableau D-2 : Les réf
- Page 115 and 116:
Annexe D 661 Signalons enfin que le
- Page 117 and 118:
Annexe D 663 Tableau D-6: Résultat
- Page 119 and 120:
Annexe D 665 corrections effectuée
- Page 121 and 122:
Annexe D 667 nombre de salariés ob
- Page 123 and 124:
Annexe D 669 Tableau D-10: Les tabl
- Page 125 and 126:
Annexe D 671 Lecture : Pour les ann
- Page 127 and 128:
Annexe D 673 Tableau D-14 : Résult
- Page 129 and 130:
Annexe D 675 Tableau D-16 : Résult
- Page 131 and 132:
ANNEXE E Estimation de séries homo
- Page 133 and 134:
Annexe E 679 Tableau E-1: Le salair
- Page 135 and 136:
Annexe E 681 1946 semble plus fiabl
- Page 137 and 138:
Annexe E 683 La colonne (3) du tabl
- Page 139 and 140:
Annexe E 685 Tableau E-3 (suite et
- Page 141 and 142:
Annexe E 687 les ouvriers agricoles
- Page 143 and 144:
ANNEXE F Les indices de prix à la
- Page 145 and 146:
Annexe F 691 Tableau F-1 (suite et
- Page 147 and 148:
ANNEXE G Méthodologie et résultat
- Page 149 and 150:
Annexe G 695 Tableau G-1 : PIB, RPB
- Page 151 and 152:
Annexe G 697 Tableau G-2 : Revenu f
- Page 153 and 154:
Annexe G 699 années de guerre 1 .
- Page 155 and 156:
Annexe G 701 été menée en 1956,
- Page 157 and 158:
Annexe G 703 que lors de la Libéra
- Page 159 and 160:
Annexe G 705 Tableau G-4 (suite et
- Page 161 and 162:
Annexe G 707 fectuer les décomposi
- Page 163 and 164:
Annexe G 709 rentes. En particulier
- Page 165 and 166:
Annexe G 711 Tableau G-6: Décompos
- Page 167 and 168: Annexe G 713 Tableau G-9: Décompos
- Page 169 and 170: Annexe G 715 Tableau G-13: L’éva
- Page 171 and 172: Annexe G 717 Tableau G-17 : Décomp
- Page 173 and 174: Annexe G 719 (2) et (3) = revenu na
- Page 175 and 176: ANNEXE H Population, ménages et st
- Page 177 and 178: Annexe H 723 Tableau H-1 (suite et
- Page 179 and 180: Annexe H 725 cours de la première
- Page 181 and 182: Annexe H 727 Tableau H-3: La répar
- Page 183 and 184: Annexe H 729 Tableau H-5: Le nombre
- Page 185 and 186: Annexe I 731 fiscaux » peuvent con
- Page 187 and 188: Annexe I 733 nière fois que le CER
- Page 189 and 190: Annexe I 735 nées 1960 selon les
- Page 191 and 192: Annexe I 737 connu une très nette
- Page 193 and 194: Annexe I 739 locatives aux revenus
- Page 195 and 196: Annexe I 741 peine plus de 10 % des
- Page 197 and 198: Annexe I 743 l’IGR. Mais les rép
- Page 199 and 200: Annexe J 745 au cours d’une anné
- Page 201 and 202: Annexe J 747 1932 1933 1935 1936 Ta
- Page 203 and 204: Annexe J 749 Tableau J-2 : Les réf
- Page 205 and 206: Annexe J 751 Tableau J-3: Les table
- Page 207 and 208: Annexe J 753 « répartition » : l
- Page 209 and 210: Annexe J 755 Précisons également
- Page 211 and 212: Annexe J 757 1937 1938 1939 1940 Ta
- Page 213 and 214: Annexe J 759 Tableau J-5: Résultat
- Page 215 and 216: Annexe J 761 Tableau J-7: Résultat
- Page 217: Annexe J 763 Tableau J-9: Résultat
- Page 221 and 222: 3.1. Parts successorales, successio
- Page 223 and 224: Annexe J 769 La loi du 3 août 1926
- Page 225 and 226: Annexe J 771 300 000 francs 1 . Le
- Page 227 and 228: Annexe K 773 que pour les extrapola
- Page 229 and 230: Annexe K 775 Tableau K-3: Les coeff
- Page 231 and 232: TABLE DES TABLEAUX ET GRAPHIQUES Ta
- Page 233 and 234: Table des tableaux et graphiques 79
- Page 235 and 236: Table des tableaux et graphiques 79
- Page 237: Table des tableaux et graphiques 79
- Page 240 and 241: 802 Les hauts revenus en France au
- Page 242 and 243: 804 Les hauts revenus en France au
- Page 244 and 245: 806 Les hauts revenus en France au