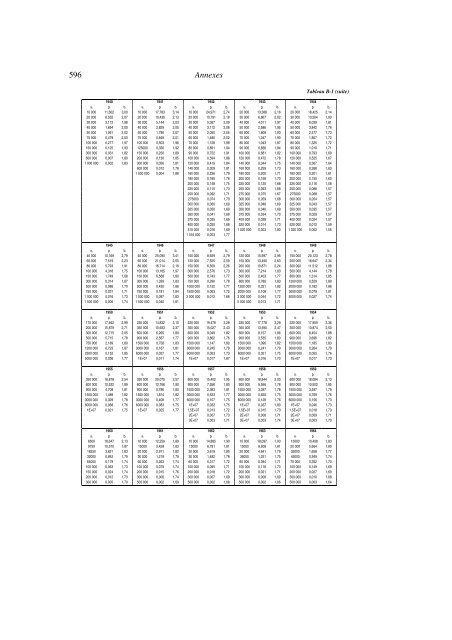
596 Annexes 1940 1941 1942 1943 1944 Tableau B-1 (suite) si pi bi si pi bi si pi bi si pi bi si pi bi 10 000 11,602 3,00 10 000 17,783 3,14 10 000 24,971 2,74 20 000 13,388 2,16 20 000 18,425 2,14 20 000 6,532 2,07 20 000 10,439 2,13 20 000 10,791 2,18 30 000 6,867 2,02 30 000 10,264 1,90 30 000 3,112 1,98 30 000 5,144 2,03 30 000 5,367 2,09 40 000 4,011 1,97 40 000 6,039 1,81 40 000 1,694 2,00 40 000 2,829 2,05 40 000 3,112 2,08 50 000 2,586 1,95 50 000 3,842 1,76 50 000 1,061 2,02 50 000 1,796 2,07 50 000 2,050 2,05 60 000 1,808 1,93 60 000 2,577 1,73 75 000 0,479 2,00 75 000 0,849 2,01 60 000 1,480 2,02 70 000 1,347 1,90 70 000 1,807 1,72 100 000 0,277 1,97 100 000 0,503 1,96 70 000 1,128 1,98 80 000 1,043 1,87 80 000 1,325 1,72 150 000 0,125 1,93 125000 0,330 1,92 80 000 0,891 1,94 90 000 0,836 1,84 90 000 1,010 1,71 300 000 0,031 1,82 150 000 0,230 1,89 90 000 0,722 1,91 100 000 0,681 1,82 100 000 0,793 1,69 600 000 0,007 1,80 200 000 0,130 1,85 100 000 0,594 1,88 120 000 0,472 1,78 120 000 0,525 1,67 1 000 000 0,002 1,83 300 000 0,056 1,81 120 000 0,419 1,84 140 000 0,344 1,75 140 000 0,367 1,64 600 000 0,012 1,78 140 000 0,309 1,81 160 000 0,259 1,73 160 000 0,268 1,63 1 000 000 0,004 1,86 160 000 0,236 1,79 180 000 0,200 1,71 180 000 0,201 1,61 180 000 0,185 1,76 200 000 0,158 1,70 200 000 0,155 1,60 200 000 0,148 1,75 225 000 0,120 1,68 225 000 0,116 1,58 225 000 0,115 1,73 250 000 0,093 1,68 250 000 0,088 1,57 250 000 0,092 1,71 275 000 0,075 1,67 275000 0,068 1,57 275000 0,074 1,70 300 000 0,059 1,68 300 000 0,054 1,57 300 000 0,060 1,69 325 000 0,048 1,69 325 000 0,043 1,57 325 000 0,050 1,69 350 000 0,040 1,69 350 000 0,035 1,57 350 000 0,041 1,69 375 000 0,034 1,70 375 000 0,029 1,57 375 000 0,035 1,69 400 000 0,028 1,71 400 000 0,024 1,57 400 000 0,030 1,68 520 000 0,014 1,73 520 000 0,012 1,59 510 000 0,016 1,69 1 020 000 0,003 1,80 1 020 000 0,002 1,55 1 010 000 0,003 1,77 1945 1946 1947 1948 1949 si pi bi si pi bi si pi bi si pi bi si pi bi 40 000 10,169 2,79 40 000 25,090 3,41 100 000 8,929 2,79 120 000 15,997 2,95 150 000 20,123 2,78 60 000 7,519 2,23 60 000 21,014 2,55 120 000 7,525 2,59 150 000 13,490 2,63 200 000 16,647 2,34 80 000 5,793 1,91 80 000 16,714 2,18 150 000 6,509 2,26 200 000 10,871 2,24 300 000 11,512 1,88 100 000 4,318 1,75 100 000 13,185 1,97 300 000 2,576 1,73 300 000 7,214 1,83 500 000 4,144 1,78 150 000 1,749 1,68 150 000 6,568 1,80 500 000 0,743 1,77 500 000 2,403 1,77 800 000 1,314 1,85 300 000 0,314 1,67 300 000 1,339 1,83 750 000 0,290 1,78 800 000 0,780 1,83 1200 000 0,529 1,89 500 000 0,086 1,70 500 000 0,430 1,86 1000 000 0,152 1,77 1200 000 0,321 1,82 2000 000 0,182 1,86 750 000 0,031 1,71 750 000 0,181 1,84 1500 000 0,063 1,72 2000 000 0,108 1,77 3000 000 0,079 1,81 1 000 000 0,016 1,73 1 000 000 0,097 1,83 3 000 000 0,012 1,66 3 000 000 0,044 1,72 5000 000 0,027 1,74 1 500 000 0,006 1,74 1 500 000 0,040 1,81 5 000 000 0,013 1,71 1950 1951 1952 1953 1954 si pi bi si pi bi si pi bi si pi bi si pi bi 170 000 17,462 2,99 220 000 14,832 3,10 220 000 19,478 3,28 220 000 17,778 3,29 220 000 17,959 3,36 200 000 15,879 2,71 350 000 10,933 2,37 350 000 15,027 2,43 350 000 13,590 2,47 350 000 13,874 2,50 300 000 12,715 2,05 600 000 6,265 1,80 600 000 9,049 1,82 600 000 8,157 1,86 600 000 8,454 1,88 500 000 5,715 1,78 900 000 2,567 1,77 900 000 3,862 1,76 900 000 3,535 1,80 900 000 3,696 1,82 750 000 2,189 1,80 1500 000 0,758 1,83 1500 000 1,147 1,80 1500 000 1,096 1,82 1500 000 1,185 1,83 1200 000 0,723 1,87 3000 000 0,167 1,81 3000 000 0,245 1,79 3000 000 0,241 1,79 3000 000 0,264 1,79 2500 000 0,152 1,85 6000 000 0,037 1,77 6000 000 0,053 1,73 6000 000 0,051 1,75 6000 000 0,055 1,76 5000 000 0,036 1,77 1E+07 0,011 1,74 1E+07 0,017 1,67 1E+07 0,016 1,70 1E+07 0,017 1,73 1955 1956 1957 1958 1959 si pi bi si pi bi si pi bi si pi bi si pi bi 350 000 16,878 2,54 350 000 20,075 2,57 600 000 15,402 1,95 600 000 18,844 2,00 600 000 18,084 2,13 600 000 10,532 1,89 600 000 12,766 1,90 900 000 7,556 1,80 900 000 9,956 1,78 900 000 10,502 1,85 900 000 4,708 1,81 900 000 5,796 1,80 1500 000 2,383 1,81 1500 000 3,097 1,78 1500 000 3,597 1,79 1500 000 1,488 1,82 1500 000 1,814 1,82 3000 000 0,523 1,77 3000 000 0,650 1,75 3000 000 0,769 1,76 3000 000 0,329 1,78 3000 000 0,408 1,77 6000 000 0,107 1,75 6000 000 0,128 1,76 6000 000 0,156 1,73 6000 000 0,068 1,76 6000 000 0,083 1,75 1E+07 0,032 1,75 1E+07 0,037 1,80 1E+07 0,046 1,73 1E+07 0,021 1,75 1E+07 0,025 1,77 1,5E+07 0,013 1,72 1,5E+07 0,015 1,73 1,5E+07 0,018 1,73 2E+07 0,007 1,73 2E+07 0,008 1,71 2E+07 0,009 1,71 3E+07 0,003 1,71 3E+07 0,003 1,74 3E+07 0,003 1,70 1960 1961 1962 1963 1964 si pi bi si pi bi si pi bi si pi bi si pi bi 6500 18,647 2,13 10 000 12,259 1,89 10 000 14,885 1,90 10 000 18,097 1,93 15000 10,408 1,83 9750 10,570 1,87 15000 5,428 1,83 15000 6,781 1,81 15000 8,608 1,81 20 000 5,664 1,80 16250 3,621 1,83 20 000 2,911 1,82 20 000 3,619 1,80 20 000 4,641 1,79 35000 1,658 1,77 32000 0,842 1,79 30 000 1,219 1,79 30 000 1,482 1,78 36000 1,251 1,75 45000 0,949 1,74 64000 0,179 1,74 60 000 0,263 1,74 60 000 0,317 1,72 60 000 0,394 1,71 70 000 0,352 1,70 100 000 0,063 1,73 100 000 0,079 1,74 100 000 0,095 1,71 100 000 0,116 1,70 100 000 0,149 1,69 150 000 0,024 1,74 200 000 0,015 1,76 200 000 0,018 1,72 200 000 0,021 1,71 200 000 0,027 1,69 200 000 0,012 1,73 300 000 0,006 1,74 300 000 0,007 1,69 300 000 0,008 1,69 300 000 0,010 1,68 300 000 0,005 1,70 500 000 0,002 1,69 500 000 0,002 1,68 500 000 0,002 1,66 500 000 0,003 1,64
Annexe B 597 1965 1966 1967 1968 1969 Tableau B-1 (suite et fin) si pi bi si pi bi si pi bi si pi bi si pi bi 15000 12,102 1,85 15000 13,651 1,85 15000 15,488 1,88 15000 17,930 1,86 20 000 12,443 1,80 20 000 6,707 1,81 20 000 7,608 1,80 20 000 8,820 1,82 20 000 10,322 1,79 25000 7,758 1,77 35000 1,978 1,76 35000 2,214 1,77 35000 2,611 1,78 35000 2,966 1,76 30 000 5,124 1,76 50 000 0,890 1,74 50 000 0,993 1,75 50 000 1,175 1,77 50 000 1,302 1,75 50 000 1,572 1,76 70 000 0,418 1,70 70 000 0,466 1,72 70 000 0,557 1,74 70 000 0,601 1,74 70 000 0,731 1,75 100 000 0,177 1,69 100 000 0,201 1,71 100 000 0,245 1,72 100 000 0,260 1,73 100 000 0,321 1,73 200 000 0,032 1,70 200 000 0,037 1,72 200 000 0,046 1,75 200 000 0,049 1,76 200 000 0,060 1,77 300 000 0,012 1,69 300 000 0,014 1,72 300 000 0,018 1,75 300 000 0,019 1,77 400 000 0,012 1,81 500 000 0,003 1,68 500 000 0,004 1,72 500 000 0,005 1,73 500 000 0,006 1,75 1970 1971 1972 1973 1974 si pi bi si pi bi si pi bi si pi bi si pi bi 20 000 15,081 1,82 25000 11,763 1,80 25000 14,112 1,81 30 000 12,772 1,81 30 000 17,593 1,80 30 000 6,399 1,77 30 000 7,914 1,78 30 000 9,582 1,80 40 000 6,696 1,82 40 000 9,425 1,77 40 000 3,306 1,76 40 000 4,095 1,79 40 000 4,969 1,80 50 000 4,010 1,83 50 000 5,571 1,79 50 000 1,979 1,76 50 000 2,461 1,79 50 000 2,980 1,81 70 000 1,908 1,83 70 000 2,569 1,79 70 000 0,923 1,75 70 000 1,160 1,77 70 000 1,415 1,80 100 000 0,881 1,81 100 000 1,166 1,78 100 000 0,409 1,73 100 000 0,526 1,75 100 000 0,648 1,78 200 000 0,190 1,79 200 000 0,247 1,73 200 000 0,078 1,72 200 000 0,104 1,72 200 000 0,135 1,74 400 000 0,038 1,85 400 000 0,047 1,74 400 000 0,014 1,77 400 000 0,019 1,76 400 000 0,025 1,80 1975 1976 1977 1978 1979 si pi bi si pi bi si pi bi si pi bi si pi bi 40 000 13,289 1,76 50 000 10,816 1,75 50 000 13,568 1,73 60 000 11,647 1,72 70 000 10,335 1,74 50 000 7,922 1,76 70 000 4,808 1,78 70 000 6,054 1,73 70 000 8,029 1,73 80 000 7,453 1,74 70 000 3,540 1,78 100 000 2,098 1,79 100 000 2,533 1,75 80 000 5,751 1,74 100 000 4,287 1,77 100 000 1,578 1,78 200 000 0,453 1,74 200 000 0,503 1,74 100 000 3,318 1,76 200 000 0,881 1,77 200 000 0,336 1,73 400 000 0,088 1,75 400 000 0,097 1,77 200 000 0,678 1,74 400 000 0,178 1,77 400 000 0,064 1,75 400 000 0,132 1,75 1980 1981 1982 1983 1984 si pi bi si pi bi si pi bi si pi bi si pi bi 80 000 10,146 1,72 80 000 14,009 1,71 100 000 10,773 1,67 100 000 14,596 1,65 100 000 16,768 1,67 100 000 5,798 1,74 100 000 8,162 1,71 150 000 3,841 1,69 125000 8,431 1,64 125000 9,934 1,64 200 000 1,122 1,76 200 000 1,500 1,75 200 000 1,882 1,70 150 000 5,196 1,65 150 000 6,174 1,64 400 000 0,225 1,76 400 000 0,290 1,77 400 000 0,342 1,72 200 000 2,456 1,66 200 000 2,888 1,66 400 000 0,427 1,67 250 000 1,640 1,66 500 000 0,282 1,68 1985 1986 1987 1988 1989 si pi bi si pi bi si pi bi si pi bi si pi bi 125000 11,395 1,65 125000 12,460 1,68 125000 12,953 1,70 125000 13,941 1,72 150 000 10,099 1,73 150 000 7,199 1,65 150 000 8,005 1,67 150 000 8,407 1,70 150 000 9,187 1,71 200 000 4,980 1,76 200 000 3,384 1,67 200 000 3,805 1,69 200 000 4,050 1,72 200 000 4,505 1,73 250 000 2,885 1,78 250 000 1,920 1,68 250 000 2,170 1,70 250 000 2,319 1,74 250 000 2,625 1,74 500 000 0,570 1,84 500 000 0,340 1,69 500 000 0,399 1,72 500 000 0,446 1,78 500 000 0,544 1,72 1990 1991 1992 1993 1994 si pi bi si pi bi si pi bi si pi bi si pi bi 150 000 11,207 1,74 150 000 12,049 1,72 150 000 12,651 1,70 150 000 12,941 1,69 150 000 13,231 1,70 200 000 5,617 1,75 200 000 6,074 1,71 200 000 6,393 1,69 200 000 6,558 1,67 200 000 6,741 1,67 250 000 3,252 1,77 250 000 3,484 1,73 250 000 3,627 1,70 250 000 3,704 1,68 250 000 3,796 1,68 500 000 0,626 1,84 500 000 0,640 1,80 500 000 0,639 1,77 500 000 0,631 1,76 500 000 0,641 1,78 1995 1996 1997 1998 si pi bi si pi bi si pi bi si pi bi 150 000 13,696 1,70 150 000 13,988 1,70 150 000 14,388 1,71 150 000 15,121 1,72 200 000 7,042 1,67 200 000 7,268 1,66 200 000 7,554 1,66 200 000 8,057 1,66 250 000 3,970 1,68 250 000 4,116 1,66 250 000 4,284 1,67 250 000 4,591 1,67 500 000 0,668 1,76 500 000 0,673 1,76 500 000 0,701 1,78 500 000 0,752 1,77 Sources: Résultats de calculs effectués directement à partir des données brutes reproduites sur le tableau A-1 (et de la colonne (10) du tableau H-1 pour le nombre total de foyers (imposables et non imposables)). Lecture: si représente les seuils des tranches de revenu imposable utilisés par l’administration fiscale; pi représente le nombre de foyers ayant déclaré un revenu supérieur à si, exprimé en % du nombre total de foyers (imposables et non imposables); bi représente le ratio entre le revenu moyen des foyers ayant déclaré un revenu supérieur à si et le revenu si. Par exemple, au titre des revenus de 1970, 3 024 foyers foyers ont déclaré un revenu supérieur à 400 000 francs, et ces foyers ont déclaré un revenu total de 2,143 milliards de francs (cf. tableau A-1); le nombre total de foyers était en 1970 de 21,033 millions (cf. tableau H-1, colonne (10)); il en ressort que 0,014 % des foyers ont déclaré un revenu supérieur à 400 000 francs (pi = 3 024/21 033 070 = 0,014 %), et que ces foyers ont déclaré un revenu égal (en moyenne) à 1,77 fois 400 000 francs (bi. = (2 143 339 000/3 024)/400 000 = 1,77). 1.1.3. La technique d’approximation utilisée Dans le cadre de ce livre, nous avons utilisé une technique d’approximation légèrement différente, consistant à exploiter directement l’information contenue dans les coefficients bi. Nous avons procédé de la
- Page 1 and 2: LES HAUTS REVENUS EN FRANCE AU XX e
- Page 3 and 4: THOMAS PIKETTY LES HAUTS REVENUS EN
- Page 5: SOMMAIRE Remerciements . . . . . .
- Page 9 and 10: ANNEXE A Les tableaux statistiques
- Page 11 and 12: Annexe A 557 1935 1936 1937 1938 Ta
- Page 13 and 14: Annexe A 559 1971 1972 1973 1974 Ta
- Page 15 and 16: Annexe A 561 de la tranche de reven
- Page 17 and 18: Annexe A 563 effectivement été im
- Page 19 and 20: Annexe A 565 toutes les autres majo
- Page 21 and 22: Annexe A 567 Tableau A-2 (suite et
- Page 23 and 24: Annexe A 569 tableaux « répartiti
- Page 25 and 26: Annexe A 571 Ces publications du mi
- Page 27 and 28: Annexe A 573 tulés « Les impôts
- Page 29 and 30: Annexe A 575 Tableau A-6: Le rythme
- Page 31 and 32: Annexe A 577 Tableau A-7 : Le monta
- Page 33 and 34: Annexe A 579 1936 était de 1,342 m
- Page 35 and 36: Annexe A 581 Tableau A-9: Le cas de
- Page 37 and 38: Annexe A 583 millions de francs de
- Page 39 and 40: Annexe A 585 (v) Nous avons regroup
- Page 41 and 42: Annexe A 587 France », « revenus
- Page 43 and 44: Annexe A 589 Commençons par les ta
- Page 45 and 46: Annexe A 591 La suppression en 1959
- Page 47 and 48: Annexe B 593 (P90-95 est le revenu
- Page 49: Annexe B 595 Tableau B-1: Les coeff
- Page 53 and 54: Annexe B 599 plus bas peuvent être
- Page 55 and 56: Annexe B 601 comparées aux fluctua
- Page 57 and 58: Annexe B 603 Tableau B-2 (suite et
- Page 59 and 60: Annexe B 605 Tableau B-4 (suite et
- Page 61 and 62: Annexe B 607 foyers dont le revenu
- Page 63 and 64: Annexe B 609 Tableau B-5: Les taux
- Page 65 and 66: Annexe B 611 Tableau B-6: Les taux
- Page 67 and 68: Annexe B 613 Tableau B-8 (suite et
- Page 69 and 70: Annexe B 615 Tableau B-10: Résulta
- Page 71 and 72: Annexe B 617 Tableau B-11 (suite et
- Page 73 and 74: Annexe B 619 Tableau B-13 (suite et
- Page 75 and 76: Annexe B 621 Tableau B-14 (suite et
- Page 77 and 78: Annexe B 623 période). Il est donc
- Page 79 and 80: Annexe B 625 Tableau B-16: Les rés
- Page 81 and 82: Annexe B 627 Tableau B-16 (suite) 1
- Page 83 and 84: Annexe B 629 Les tableaux B-17 et B
- Page 85 and 86: Annexe B 631 P99-99,5 P99,5-99,9 P9
- Page 87 and 88: Annexe B 633 P99,9-100 P99,99-100 P
- Page 89 and 90: Annexe B 635 des différents fracti
- Page 91 and 92: Annexe B 637 Tableau B-20 (suite et
- Page 93 and 94: Annexe B 639 (pour le revenu imposa
- Page 95 and 96: Annexe B 641 Tableau B-22 (suite et
- Page 97 and 98: Annexe B 643 estimations des taux m
- Page 99 and 100: Annexe B 645 marges d’erreur maxi
- Page 101 and 102:
ANNEXE C Données complémentaires
- Page 103 and 104:
Annexe C 649 Tableau C-3 : Les plaf
- Page 105 and 106:
Annexe C 651 Tableau C-6: Les barè
- Page 107 and 108:
2. CHRONOLOGIE DES PRINCIPAUX TEXTE
- Page 109 and 110:
Annexe C 655 Loi du 12/7/1965 : cr
- Page 111 and 112:
ANNEXE D Données brutes, méthodol
- Page 113 and 114:
Annexe D 659 Tableau D-2 : Les réf
- Page 115 and 116:
Annexe D 661 Signalons enfin que le
- Page 117 and 118:
Annexe D 663 Tableau D-6: Résultat
- Page 119 and 120:
Annexe D 665 corrections effectuée
- Page 121 and 122:
Annexe D 667 nombre de salariés ob
- Page 123 and 124:
Annexe D 669 Tableau D-10: Les tabl
- Page 125 and 126:
Annexe D 671 Lecture : Pour les ann
- Page 127 and 128:
Annexe D 673 Tableau D-14 : Résult
- Page 129 and 130:
Annexe D 675 Tableau D-16 : Résult
- Page 131 and 132:
ANNEXE E Estimation de séries homo
- Page 133 and 134:
Annexe E 679 Tableau E-1: Le salair
- Page 135 and 136:
Annexe E 681 1946 semble plus fiabl
- Page 137 and 138:
Annexe E 683 La colonne (3) du tabl
- Page 139 and 140:
Annexe E 685 Tableau E-3 (suite et
- Page 141 and 142:
Annexe E 687 les ouvriers agricoles
- Page 143 and 144:
ANNEXE F Les indices de prix à la
- Page 145 and 146:
Annexe F 691 Tableau F-1 (suite et
- Page 147 and 148:
ANNEXE G Méthodologie et résultat
- Page 149 and 150:
Annexe G 695 Tableau G-1 : PIB, RPB
- Page 151 and 152:
Annexe G 697 Tableau G-2 : Revenu f
- Page 153 and 154:
Annexe G 699 années de guerre 1 .
- Page 155 and 156:
Annexe G 701 été menée en 1956,
- Page 157 and 158:
Annexe G 703 que lors de la Libéra
- Page 159 and 160:
Annexe G 705 Tableau G-4 (suite et
- Page 161 and 162:
Annexe G 707 fectuer les décomposi
- Page 163 and 164:
Annexe G 709 rentes. En particulier
- Page 165 and 166:
Annexe G 711 Tableau G-6: Décompos
- Page 167 and 168:
Annexe G 713 Tableau G-9: Décompos
- Page 169 and 170:
Annexe G 715 Tableau G-13: L’éva
- Page 171 and 172:
Annexe G 717 Tableau G-17 : Décomp
- Page 173 and 174:
Annexe G 719 (2) et (3) = revenu na
- Page 175 and 176:
ANNEXE H Population, ménages et st
- Page 177 and 178:
Annexe H 723 Tableau H-1 (suite et
- Page 179 and 180:
Annexe H 725 cours de la première
- Page 181 and 182:
Annexe H 727 Tableau H-3: La répar
- Page 183 and 184:
Annexe H 729 Tableau H-5: Le nombre
- Page 185 and 186:
Annexe I 731 fiscaux » peuvent con
- Page 187 and 188:
Annexe I 733 nière fois que le CER
- Page 189 and 190:
Annexe I 735 nées 1960 selon les
- Page 191 and 192:
Annexe I 737 connu une très nette
- Page 193 and 194:
Annexe I 739 locatives aux revenus
- Page 195 and 196:
Annexe I 741 peine plus de 10 % des
- Page 197 and 198:
Annexe I 743 l’IGR. Mais les rép
- Page 199 and 200:
Annexe J 745 au cours d’une anné
- Page 201 and 202:
Annexe J 747 1932 1933 1935 1936 Ta
- Page 203 and 204:
Annexe J 749 Tableau J-2 : Les réf
- Page 205 and 206:
Annexe J 751 Tableau J-3: Les table
- Page 207 and 208:
Annexe J 753 « répartition » : l
- Page 209 and 210:
Annexe J 755 Précisons également
- Page 211 and 212:
Annexe J 757 1937 1938 1939 1940 Ta
- Page 213 and 214:
Annexe J 759 Tableau J-5: Résultat
- Page 215 and 216:
Annexe J 761 Tableau J-7: Résultat
- Page 217 and 218:
Annexe J 763 Tableau J-9: Résultat
- Page 219 and 220:
Annexe J 765 Tableau J-11: Résulta
- Page 221 and 222:
3.1. Parts successorales, successio
- Page 223 and 224:
Annexe J 769 La loi du 3 août 1926
- Page 225 and 226:
Annexe J 771 300 000 francs 1 . Le
- Page 227 and 228:
Annexe K 773 que pour les extrapola
- Page 229 and 230:
Annexe K 775 Tableau K-3: Les coeff
- Page 231 and 232:
TABLE DES TABLEAUX ET GRAPHIQUES Ta
- Page 233 and 234:
Table des tableaux et graphiques 79
- Page 235 and 236:
Table des tableaux et graphiques 79
- Page 237:
Table des tableaux et graphiques 79
- Page 240 and 241:
802 Les hauts revenus en France au
- Page 242 and 243:
804 Les hauts revenus en France au
- Page 244 and 245:
806 Les hauts revenus en France au