- Page 1:
UNIVERSITÉ MONTPELLIER IISCIENCES
- Page 7 and 8:
RemerciementsCette thèse est le fr
- Page 9 and 10:
RemerciementsJe remercie JeanPaul
- Page 11:
SommaireIntroduction. 11. Zoonoses
- Page 15:
Liste des annexesAnnexe 1 (p. 161):
- Page 19 and 20:
IntroductionIntroduction.En 2008, p
- Page 21 and 22:
IntroductionDe nombreux facteurs fa
- Page 23 and 24:
Introductionpourquoi le parasite es
- Page 25 and 26:
Introduction4. Objectifs et questio
- Page 27:
CHAPITRE I:ACTIVITÉS HUMAINES, PAR
- Page 30 and 31:
Chapitre I1. Activités humaines et
- Page 32 and 33:
Chapitre I12
- Page 34 and 35:
Chapitre I14
- Page 36 and 37:
Chapitre I16
- Page 38 and 39:
Chapitre I18
- Page 40 and 41:
Chapitre I20
- Page 42 and 43:
Chapitre I22
- Page 44 and 45:
Chapitre I24
- Page 46 and 47:
Chapitre I26
- Page 48 and 49:
Chapitre I28
- Page 50 and 51:
Chapitre I30
- Page 53 and 54: Influenza aviaires en CamargueChapi
- Page 55 and 56: Influenza aviaires en Camargue1.3.
- Page 57 and 58: Influenza aviaires en Camarguebiolo
- Page 59 and 60: Influenza aviaires en Camargued'hyb
- Page 61 and 62: Influenza aviaires en Camargued'inf
- Page 63 and 64: Influenza aviaires en CamargueP < 0
- Page 65 and 66: Influenza aviaires en Camargue3.2.
- Page 67 and 68: Influenza aviaires en CamargueArtic
- Page 69 and 70: Influenza aviaires en Camargue47
- Page 71 and 72: Influenza aviaires en Camargue49
- Page 73 and 74: Influenza aviaires en Camargue51
- Page 75 and 76: Influenza aviaires en CamargueArtic
- Page 77 and 78: Influenza aviaires en Camargue55
- Page 79 and 80: Influenza aviaires en Camargue57
- Page 81 and 82: Influenza aviaires en CamargueArtic
- Page 83 and 84: Influenza aviaires en CamargueAvian
- Page 85 and 86: Influenza aviaires en CamargueIntro
- Page 87 and 88: Influenza aviaires en Camarguedynam
- Page 89 and 90: Influenza aviaires en Camarguemecha
- Page 91 and 92: Influenza aviaires en Camargueand c
- Page 93 and 94: Influenza aviaires en CamargueThese
- Page 95 and 96: Influenza aviaires en Camarguela Re
- Page 97 and 98: Influenza aviaires en CamargueJourd
- Page 99 and 100: Influenza aviaires en CamargueEcolo
- Page 101: Influenza aviaires en CamargueTable
- Page 105 and 106: Influenza aviaires en CamargueOnlin
- Page 107 and 108: Influenza aviaires en Camarguemodel
- Page 109 and 110: Influenza aviaires en Camarguemigra
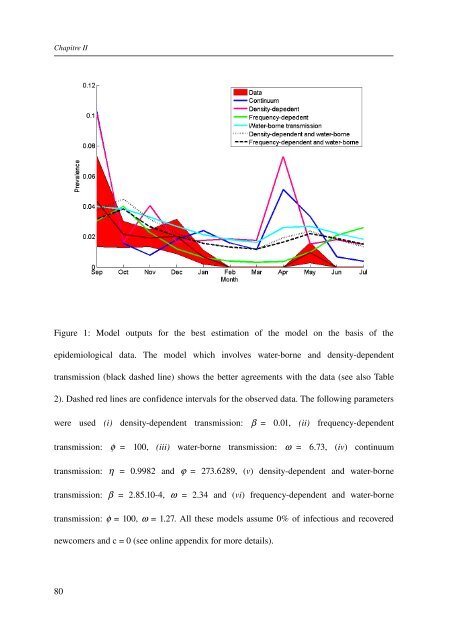
- Page 111 and 112: Influenza aviaires en CamargueFigur
- Page 113: CHAPITRE III:ÉMERGENCE DU VIRUS H5
- Page 116 and 117: Chapitre IIIgénome de ces virus à
- Page 118 and 119: Chapitre IIImigrateurs dans l'arriv
- Page 120 and 121: Chapitre III96
- Page 122 and 123: Chapitre III98
- Page 124 and 125: Chapitre III100
- Page 126 and 127: Chapitre III102
- Page 128 and 129: Chapitre III104
- Page 130 and 131: Chapitre III106
- Page 132 and 133: Chapitre III108
- Page 134 and 135: Chapitre III110
- Page 136 and 137: Chapitre III112
- Page 138 and 139: Chapitre III114
- Page 140 and 141: Chapitre III116
- Page 142 and 143: Chapitre III118
- Page 144 and 145: Chapitre III120
- Page 146 and 147: Chapitre IIIAbstractBackground: Sin
- Page 148 and 149: Chapitre IIIbeen victims of recurre
- Page 150 and 151: Chapitre IIIcombinations). Many var
- Page 152 and 153:
Chapitre IIIdifferent families [2],
- Page 154 and 155:
Chapitre IIIreported, in Bewick's s
- Page 156 and 157:
Chapitre IIIunder the artificial co
- Page 158 and 159:
Chapitre IIIfor Research and Techno
- Page 160 and 161:
Chapitre III14. Butler D: Blogger r
- Page 162 and 163:
Chapitre III28. Banks J, Speidel EC
- Page 164 and 165:
Chapitre III44. SturmRamirez KM,
- Page 166 and 167:
Chapitre IIIlocally and at a distan
- Page 168 and 169:
Chapitre III144
- Page 171 and 172:
Discussion générale et perspectiv
- Page 173 and 174:
Discussion générale et perspectiv
- Page 175 and 176:
Discussion générale et perspectiv
- Page 177:
Discussion générale et perspectiv
- Page 181 and 182:
Références bibliographiquesRéfé
- Page 183 and 184:
Références bibliographiquesFouchi
- Page 185 and 186:
Références bibliographiquesKilbou
- Page 187 and 188:
Références bibliographiquesScott
- Page 189:
ANNEXES
- Page 192 and 193:
Annexe 1162
- Page 194 and 195:
Annexe 1164
- Page 196 and 197:
Annexe 1166
- Page 198 and 199:
Annexe 1168
- Page 200 and 201:
Annexe 1170
- Page 202 and 203:
Annexe 1172
- Page 204 and 205:
Annexe 1174
- Page 206 and 207:
Annexe 1176
- Page 208 and 209:
Annexe 1178
- Page 210 and 211:
Annexe 1180
- Page 212 and 213:
Annexe 1182
- Page 214 and 215:
Annexe 1184
- Page 216 and 217:
Annexe 1186
- Page 218 and 219:
Annexe 1188
- Page 220 and 221:
Annexe 1190
- Page 222 and 223:
Annexe 2192
- Page 224 and 225:
Annexe 2Ecology of ecosystems and p
- Page 226 and 227:
Annexe 2Apparent competitionWith fe
- Page 228 and 229:
Annexe 2rates decrease significantl
- Page 230 and 231:
Annexe 2(e.g. light, humidity, temp
- Page 232 and 233:
Annexe 2between species, types of p
- Page 234 and 235:
Annexe 28 Sukhdeo, M.V.K. and Herna
- Page 236 and 237:
Annexe 2diversity. Trends Ecol. Evo
- Page 238 and 239:
Annexe 267 Park, T. (1948) Experime
- Page 240 and 241:
Annexe 2BOX1: Parasitemediated ap
- Page 242 and 243:
Annexe 2(a)(b)Box 2, figure I:panel
- Page 244 and 245:
Annexe 2Mature worms manipulate cri
- Page 246 and 247:
Annexe 2216
- Page 248 and 249:
Annexe 3218
- Page 250 and 251:
Annexe 3220
- Page 253 and 254:
Espèces échantillonnées, effecti
- Page 255 and 256:
Espèces échantillonnées, effecti
- Page 257:
Espèces échantillonnées, effecti