Progetto SIMEA - Automatica - Università degli Studi di Padova
Progetto SIMEA - Automatica - Università degli Studi di Padova
Progetto SIMEA - Automatica - Università degli Studi di Padova
Create successful ePaper yourself
Turn your PDF publications into a flip-book with our unique Google optimized e-Paper software.
<strong>SIMEA</strong> Stato dell’arte energetica <strong>degli</strong> e<strong>di</strong>fici<br />
17<br />
Doc.No 20100610.<strong>SIMEA</strong>.MR.03<br />
Versione 1<br />
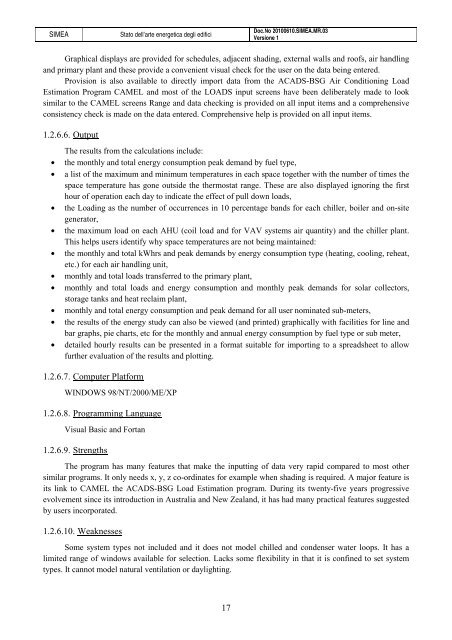
Graphical <strong>di</strong>splays are provided for schedules, adjacent sha<strong>di</strong>ng, external walls and roofs, air handling<br />
and primary plant and these provide a convenient visual check for the user on the data being entered.<br />
Provision is also available to <strong>di</strong>rectly import data from the ACADS-BSG Air Con<strong>di</strong>tioning Load<br />
Estimation Program CAMEL and most of the LOADS input screens have been deliberately made to look<br />
similar to the CAMEL screens Range and data checking is provided on all input items and a comprehensive<br />
consistency check is made on the data entered. Comprehensive help is provided on all input items.<br />
1.2.6.6. Output<br />
The results from the calculations include:<br />
• the monthly and total energy consumption peak demand by fuel type,<br />
• a list of the maximum and minimum temperatures in each space together with the number of times the<br />
space temperature has gone outside the thermostat range. These are also <strong>di</strong>splayed ignoring the first<br />
hour of operation each day to in<strong>di</strong>cate the effect of pull down loads,<br />
• the Loa<strong>di</strong>ng as the number of occurrences in 10 percentage bands for each chiller, boiler and on-site<br />
generator,<br />
• the maximum load on each AHU (coil load and for VAV systems air quantity) and the chiller plant.<br />
This helps users identify why space temperatures are not being maintained:<br />
• the monthly and total kWhrs and peak demands by energy consumption type (heating, cooling, reheat,<br />
etc.) for each air handling unit,<br />
• monthly and total loads transferred to the primary plant,<br />
• monthly and total loads and energy consumption and monthly peak demands for solar collectors,<br />
storage tanks and heat reclaim plant,<br />
• monthly and total energy consumption and peak demand for all user nominated sub-meters,<br />
• the results of the energy study can also be viewed (and printed) graphically with facilities for line and<br />
bar graphs, pie charts, etc for the monthly and annual energy consumption by fuel type or sub meter,<br />
• detailed hourly results can be presented in a format suitable for importing to a spreadsheet to allow<br />
further evaluation of the results and plotting.<br />
1.2.6.7. Computer Platform<br />
WINDOWS 98/NT/2000/ME/XP<br />
1.2.6.8. Programming Language<br />
Visual Basic and Fortan<br />
1.2.6.9. Strengths<br />
The program has many features that make the inputting of data very rapid compared to most other<br />
similar programs. It only needs x, y, z co-or<strong>di</strong>nates for example when sha<strong>di</strong>ng is required. A major feature is<br />
its link to CAMEL the ACADS-BSG Load Estimation program. During its twenty-five years progressive<br />
evolvement since its introduction in Australia and New Zealand, it has had many practical features suggested<br />
by users incorporated.<br />
1.2.6.10. Weaknesses<br />
Some system types not included and it does not model chilled and condenser water loops. It has a<br />
limited range of windows available for selection. Lacks some flexibility in that it is confined to set system<br />
types. It cannot model natural ventilation or daylighting.


