Download n.143 di DIC2011 - Architetti nell'Altotevere Libera ...
Download n.143 di DIC2011 - Architetti nell'Altotevere Libera ...
Download n.143 di DIC2011 - Architetti nell'Altotevere Libera ...

Create successful ePaper yourself
Turn your PDF publications into a flip-book with our unique Google optimized e-Paper software.
MJ/t<br />
kg CO2 eq/t<br />
5000 102,1<br />
4500<br />
4000<br />
3500<br />
3000<br />
118,6<br />
2500<br />
2000<br />
1500<br />
1000<br />
500<br />
0<br />
4449,5<br />
3982,5<br />
polistirolo espanso cellulosa<br />
350<br />
300<br />
250<br />
200<br />
150<br />
100<br />
50<br />
0<br />
PEI nr PEI r<br />
321,2 306,8<br />
polistirolo espanso cellulosa<br />
MJ/t<br />
kg CO2 eq/t<br />
5. Valori <strong>di</strong> energia incorporata e <strong>di</strong> CO 2 eq. relativi a scenari alternativi <strong>di</strong> porizzazione<br />
del laterizio e <strong>di</strong> combustibili usati nel processo produttivo, riferiti all’unità<br />
funzionale <strong>di</strong> una tonnellata <strong>di</strong> prodotto (Beccali et alii, 2009).<br />
stimento a minor impatto) e della quantità <strong>di</strong> materiale da impiegare<br />
in una certa soluzione tecnica.<br />
E ancora, la valutazione LCA riferita all’e<strong>di</strong>ficio può consentire <strong>di</strong><br />
in<strong>di</strong>viduare quale fase sia a maggior impatto ambientale, oppure una<br />
Material Profile: Clay (inclu<strong>di</strong>ng Bricks)<br />
5000<br />
4500<br />
4000<br />
102,1<br />
99,2<br />
3500<br />
3000<br />
1203,8<br />
2500<br />
2000<br />
4449,5 4185,5<br />
1500<br />
1000<br />
500<br />
0<br />
3055,7<br />
olio combustibile metano biomassa<br />
321,2<br />
PEI nr PEI r<br />
286,7<br />
219,2<br />
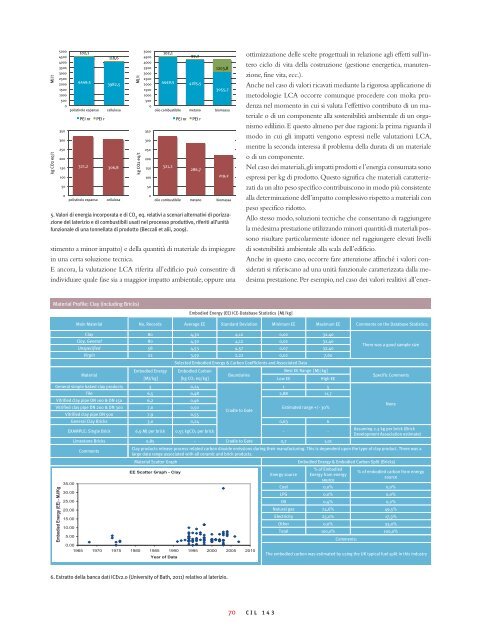
6. Estratto della banca dati ICEv2.0 (University of Bath, 2011) relativo al laterizio.<br />
350<br />
300<br />
250<br />
200<br />
150<br />
100<br />
50<br />
0<br />
olio combustibile metano biomassa<br />
Embo<strong>di</strong>ed Energy (EE) ICE-Database Statistics [MJ/kg]<br />
ottimizzazione delle scelte progettuali in relazione agli effetti sull’intero<br />
ciclo <strong>di</strong> vita della costruzione (gestione energetica, manutenzione,<br />
fine vita, ecc.).<br />
Anche nel caso <strong>di</strong> valori ricavati me<strong>di</strong>ante la rigorosa applicazione <strong>di</strong><br />
metodologie LCA occorre comunque procedere con molta prudenza<br />
nel momento in cui si valuta l’effettivo contributo <strong>di</strong> un materiale<br />
o <strong>di</strong> un componente alla sostenibilità ambientale <strong>di</strong> un organismo<br />
e<strong>di</strong>lizio. E questo almeno per due ragioni: la prima riguarda il<br />
modo in cui gli impatti vengono espressi nelle valutazioni LCA,<br />
mentre la seconda interessa il problema della durata <strong>di</strong> un materiale<br />
o <strong>di</strong> un componente.<br />
Nel caso dei materiali, gli impatti prodotti e l’energia consumata sono<br />
espressi per kg <strong>di</strong> prodotto. Questo significa che materiali caratterizzati<br />
da un alto peso specifico contribuiscono in modo più consistente<br />
alla determinazione dell’impatto complessivo rispetto a materiali con<br />
peso specifico ridotto.<br />
Allo stesso modo, soluzioni tecniche che consentano <strong>di</strong> raggiungere<br />
la medesima prestazione utilizzando minori quantità <strong>di</strong> materiali possono<br />
risultare particolarmente idonee nel raggiungere elevati livelli<br />
<strong>di</strong> sostenibilità ambientale alla scala dell’e<strong>di</strong>ficio.<br />
Anche in questo caso, occorre fare attenzione affinché i valori considerati<br />
si riferiscano ad una unità funzionale caratterizzata dalla medesima<br />
prestazione. Per esempio, nel caso dei valori realitivi all’ener-<br />
Main Material No. Records Average EE Standard Deviation Minimum EE Maximum EE Comments on the Database Statistics:<br />
Clay 80 4,30 4,12 0,02 32,40<br />
Clay, General 80 4,30 4,12 0,02 32,40<br />
Unspecified 58 4,53 4,57 0,07 32,40<br />
Virgin 22 3,59 2,22 0,02 7,60<br />
Selected Embo<strong>di</strong>ed Energy & Carbon Coefficients and Associated Data<br />
Material<br />
Embo<strong>di</strong>ed Energy<br />
[MJ/kg]<br />
Embo<strong>di</strong>ed Carbon<br />
[kg CO2 eq/kg]<br />
Boundaries<br />
Best EE Range [MJ/kg]<br />
Low EE High EE<br />
General simple baked clay products 3 0,24<br />
1 5<br />
Tile 6,5 0,48 2,88 11,7<br />
Vitrified clay pipe DN 100 & DN 150 6,2 0,46<br />
Vitrified clay pipe DN 200 & DN 300<br />
Vitrified clay pipe DN 500<br />
7,0<br />
7,9<br />
0,50<br />
0,55<br />
Cradle to Gate<br />
Estimated range +/- 30%<br />
General Clay Bricks 3,0 0,24 0,63 6<br />
EXAMPLE: Single Brick 6.9 MJ per brick 0.55 kgCO2 per brick - -<br />
Limestone Bricks 0,85 - Cradle to Gate 0,7 1,01<br />
Comments<br />
70 CIL 143<br />
There was a good sample size<br />
Specific Comments<br />
None<br />
Assuming 2.3 kg per brick (Brick<br />
Development Association estimate)<br />
Clay products release process related carbon <strong>di</strong>oxide emissions during their manufacturing. This is dependent upon the type of clay product. There was a<br />
large data range associated with all ceramic and brick products.<br />
Material Scatter Graph Embo<strong>di</strong>ed Energy & Embo<strong>di</strong>ed Carbon Split (Bricks)<br />
Energy source<br />
% of Embo<strong>di</strong>ed<br />
Energy from energy<br />
source<br />
% of embo<strong>di</strong>ed carbon from energy<br />
source<br />
Coal 0,0% 0,0%<br />
LPG 0,0% 0,0%<br />
Oil 0,4% 0,2%<br />
Natural gas 74,6% 49,5%<br />
Electricity 25,0% 17,3%<br />
Other 0,0% 33,0%<br />
Total 100,0% 100,0%<br />
Comments:<br />
The embo<strong>di</strong>ed carbon was estimated by using the UK typical fuel split in this industry