download pdf - Institut für Umweltphysik - Ruprecht-Karls-Universität ...
download pdf - Institut für Umweltphysik - Ruprecht-Karls-Universität ...
download pdf - Institut für Umweltphysik - Ruprecht-Karls-Universität ...

Create successful ePaper yourself
Turn your PDF publications into a flip-book with our unique Google optimized e-Paper software.
64 CHAPTER 2. ATMOSPHERE AND REMOTE SENSING<br />
2.4.7 Two-dimensional measurement of motorway emission plumes<br />
Participating scientist Irene Pundt, Kai Uwe Mettendorf<br />
Abstract A first Long-path Tom-DOAS experiment was carried out in April/May 2001 next to<br />
the German motorway A656 (between Heidelberg and Mannheim), as part of the BAB II campaign<br />
(Fiedler et al., 2001). From the measurements along 16 different light paths vertical profiles on both<br />
sides of the motorway as well as two-dimensional maps of the NO2, SO2 and ozone concentration<br />
distributions could be derived. Emission factors were calculated and compared to model simulations.<br />
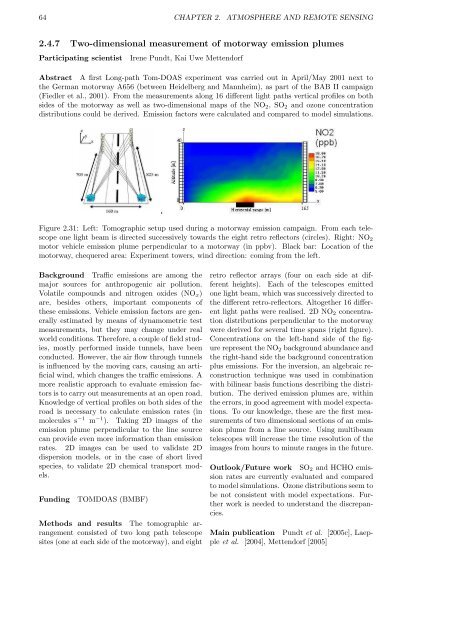
Figure 2.31: Left: Tomographic setup used during a motorway emission campaign. From each telescope<br />
one light beam is directed successively towards the eight retro reflectors (circles). Right: NO2<br />
motor vehicle emission plume perpendicular to a motorway (in ppbv). Black bar: Location of the<br />
motorway, chequered area: Experiment towers, wind direction: coming from the left.<br />
Background Traffic emissions are among the<br />
major sources for anthropogenic air pollution.<br />
Volatile compounds and nitrogen oxides (NOx)<br />
are, besides others, important components of<br />
these emissions. Vehicle emission factors are generally<br />
estimated by means of dynamometric test<br />
measurements, but they may change under real<br />
world conditions. Therefore, a couple of field studies,<br />
mostly performed inside tunnels, have been<br />
conducted. However, the air flow through tunnels<br />
is influenced by the moving cars, causing an artificial<br />
wind, which changes the traffic emissions. A<br />
more realistic approach to evaluate emission factors<br />
is to carry out measurements at an open road.<br />
Knowledge of vertical profiles on both sides of the<br />
road is necessary to calculate emission rates (in<br />
molecules s −1 m −1 ). Taking 2D images of the<br />
emission plume perpendicular to the line source<br />
can provide even more information than emission<br />
rates. 2D images can be used to validate 2D<br />
dispersion models, or in the case of short lived<br />
species, to validate 2D chemical transport models.<br />
Funding TOMDOAS (BMBF)<br />
Methods and results The tomographic arrangement<br />
consisted of two long path telescope<br />
sites (one at each side of the motorway), and eight<br />
retro reflector arrays (four on each side at different<br />
heights). Each of the telescopes emitted<br />
one light beam, which was successively directed to<br />
the different retro-reflectors. Altogether 16 different<br />
light paths were realised. 2D NO2 concentration<br />
distributions perpendicular to the motorway<br />
were derived for several time spans (right figure).<br />
Concentrations on the left-hand side of the figure<br />
represent the NO2 background abundance and<br />
the right-hand side the background concentration<br />
plus emissions. For the inversion, an algebraic reconstruction<br />
technique was used in combination<br />
with bilinear basis functions describing the distribution.<br />
The derived emission plumes are, within<br />
the errors, in good agreement with model expectations.<br />
To our knowledge, these are the first measurements<br />
of two dimensional sections of an emission<br />
plume from a line source. Using multibeam<br />
telescopes will increase the time resolution of the<br />
images from hours to minute ranges in the future.<br />
Outlook/Future work SO2 and HCHO emission<br />
rates are currently evaluated and compared<br />
to model simulations. Ozone distributions seem to<br />
be not consistent with model expectations. Further<br />
work is needed to understand the discrepancies.<br />
Main publication Pundt et al. [2005c], Laepple<br />
et al. [2004], Mettendorf [2005]