Final Technical Report: - Southwest Fisheries Science Center - NOAA
Final Technical Report: - Southwest Fisheries Science Center - NOAA
Final Technical Report: - Southwest Fisheries Science Center - NOAA
You also want an ePaper? Increase the reach of your titles
YUMPU automatically turns print PDFs into web optimized ePapers that Google loves.
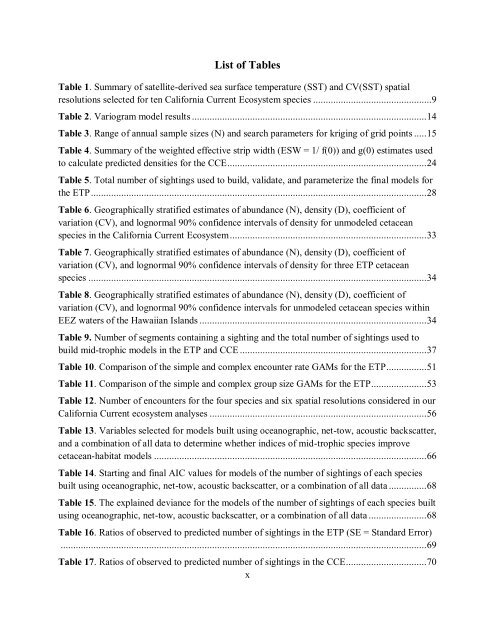
List of Tables<br />
Table 1. Summary of satellite-derived sea surface temperature (SST) and CV(SST) spatial<br />
resolutions selected for ten California Current Ecosystem species ...............................................9<br />
Table 2. Variogram model results ............................................................................................. 14<br />
Table 3. Range of annual sample sizes (N) and search parameters for kriging of grid points ..... 15<br />
Table 4. Summary of the weighted effective strip width (ESW = 1/ f(0)) and g(0) estimates used<br />
to calculate predicted densities for the CCE ............................................................................... 24<br />
Table 5. Total number of sightings used to build, validate, and parameterize the final models for<br />
the ETP ..................................................................................................................................... 28<br />
Table 6. Geographically stratified estimates of abundance (N), density (D), coefficient of<br />
variation (CV), and lognormal 90% confidence intervals of density for unmodeled cetacean<br />
species in the California Current Ecosystem .............................................................................. 33<br />
Table 7. Geographically stratified estimates of abundance (N), density (D), coefficient of<br />
variation (CV), and lognormal 90% confidence intervals of density for three ETP cetacean<br />
species ...................................................................................................................................... 34<br />
Table 8. Geographically stratified estimates of abundance (N), density (D), coefficient of<br />
variation (CV), and lognormal 90% confidence intervals for unmodeled cetacean species within<br />
EEZ waters of the Hawaiian Islands .......................................................................................... 34<br />
Table 9. Number of segments containing a sighting and the total number of sightings used to<br />
build mid-trophic models in the ETP and CCE .......................................................................... 37<br />
Table 10. Comparison of the simple and complex encounter rate GAMs for the ETP ................ 51<br />
Table 11. Comparison of the simple and complex group size GAMs for the ETP ...................... 53<br />
Table 12. Number of encounters for the four species and six spatial resolutions considered in our<br />
California Current ecosystem analyses ...................................................................................... 56<br />
Table 13. Variables selected for models built using oceanographic, net-tow, acoustic backscatter,<br />
and a combination of all data to determine whether indices of mid-trophic species improve<br />
cetacean-habitat models ............................................................................................................ 66<br />
Table 14. Starting and final AIC values for models of the number of sightings of each species<br />
built using oceanographic, net-tow, acoustic backscatter, or a combination of all data ............... 68<br />
Table 15. The explained deviance for the models of the number of sightings of each species built<br />
using oceanographic, net-tow, acoustic backscatter, or a combination of all data ....................... 68<br />
Table 16. Ratios of observed to predicted number of sightings in the ETP (SE = Standard Error)<br />
................................................................................................................................................. 69<br />
Table 17. Ratios of observed to predicted number of sightings in the CCE................................ 70<br />
x


