

Final Technical Report: - Southwest Fisheries Science Center - NOAA
Final Technical Report: - Southwest Fisheries Science Center - NOAA
Final Technical Report: - Southwest Fisheries Science Center - NOAA

Create successful ePaper yourself
Turn your PDF publications into a flip-book with our unique Google optimized e-Paper software.
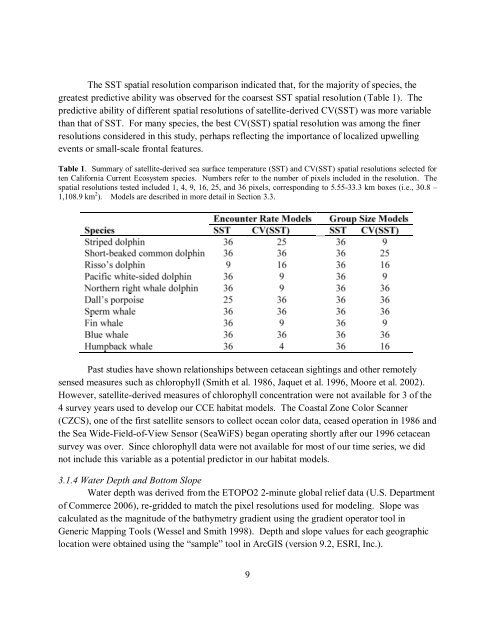
The SST spatial resolution comparison indicated that, for the majority of species, the<br />
greatest predictive ability was observed for the coarsest SST spatial resolution (Table 1). The<br />
predictive ability of different spatial resolutions of satellite-derived CV(SST) was more variable<br />
than that of SST. For many species, the best CV(SST) spatial resolution was among the finer<br />
resolutions considered in this study, perhaps reflecting the importance of localized upwelling<br />
events or small-scale frontal features.<br />
Table 1. Summary of satellite-derived sea surface temperature (SST) and CV(SST) spatial resolutions selected for<br />
ten California Current Ecosystem species. Numbers refer to the number of pixels included in the resolution. The<br />
spatial resolutions tested included 1, 4, 9, 16, 25, and 36 pixels, corresponding to 5.55-33.3 km boxes (i.e., 30.8 –<br />
1,108.9 km 2 ). Models are described in more detail in Section 3.3.<br />
Past studies have shown relationships between cetacean sightings and other remotely<br />
sensed measures such as chlorophyll (Smith et al. 1986, Jaquet et al. 1996, Moore et al. 2002).<br />
However, satellite-derived measures of chlorophyll concentration were not available for 3 of the<br />
4 survey years used to develop our CCE habitat models. The Coastal Zone Color Scanner<br />
(CZCS), one of the first satellite sensors to collect ocean color data, ceased operation in 1986 and<br />
the Sea Wide-Field-of-View Sensor (SeaWiFS) began operating shortly after our 1996 cetacean<br />
survey was over. Since chlorophyll data were not available for most of our time series, we did<br />
not include this variable as a potential predictor in our habitat models.<br />
3.1.4 Water Depth and Bottom Slope<br />
Water depth was derived from the ETOPO2 2-minute global relief data (U.S. Department<br />
of Commerce 2006), re-gridded to match the pixel resolutions used for modeling. Slope was<br />
calculated as the magnitude of the bathymetry gradient using the gradient operator tool in<br />
Generic Mapping Tools (Wessel and Smith 1998). Depth and slope values for each geographic<br />
location were obtained using the “sample” tool in ArcGIS (version 9.2, ESRI, Inc.).<br />
9


