

Final Technical Report: - Southwest Fisheries Science Center - NOAA
Final Technical Report: - Southwest Fisheries Science Center - NOAA
Final Technical Report: - Southwest Fisheries Science Center - NOAA

You also want an ePaper? Increase the reach of your titles
YUMPU automatically turns print PDFs into web optimized ePapers that Google loves.
incorporation of geographic coordinates into the model is a simple way to account for this<br />
relationship.<br />
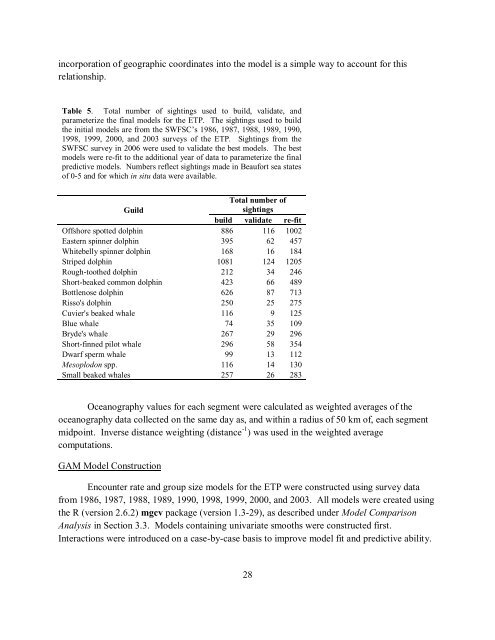
Table 5. Total number of sightings used to build, validate, and<br />
parameterize the final models for the ETP. The sightings used to build<br />
the initial models are from the SWFSC’s 1986, 1987, 1988, 1989, 1990,<br />
1998, 1999, 2000, and 2003 surveys of the ETP. Sightings from the<br />
SWFSC survey in 2006 were used to validate the best models. The best<br />
models were re-fit to the additional year of data to parameterize the final<br />
predictive models. Numbers reflect sightings made in Beaufort sea states<br />
of 0-5 and for which in situ data were available.<br />
Guild<br />
Total number of<br />
sightings<br />
build validate re-fit<br />
Offshore spotted dolphin 886 116 1002<br />
Eastern spinner dolphin 395 62 457<br />
Whitebelly spinner dolphin 168 16 184<br />
Striped dolphin 1081 124 1205<br />
Rough-toothed dolphin 212 34 246<br />
Short-beaked common dolphin 423 66 489<br />
Bottlenose dolphin 626 87 713<br />
Risso's dolphin 250 25 275<br />
Cuvier's beaked whale 116 9 125<br />
Blue whale 74 35 109<br />
Bryde's whale 267 29 296<br />
Short-finned pilot whale 296 58 354<br />
Dwarf sperm whale 99 13 112<br />
Mesoplodon spp. 116 14 130<br />
Small beaked whales 257 26 283<br />
Oceanography values for each segment were calculated as weighted averages of the<br />
oceanography data collected on the same day as, and within a radius of 50 km of, each segment<br />
midpoint. Inverse distance weighting (distance -1 ) was used in the weighted average<br />
computations.<br />
GAM Model Construction<br />
Encounter rate and group size models for the ETP were constructed using survey data<br />
from 1986, 1987, 1988, 1989, 1990, 1998, 1999, 2000, and 2003. All models were created using<br />
the R (version 2.6.2) mgcv package (version 1.3-29), as described under Model Comparison<br />
Analysis in Section 3.3. Models containing univariate smooths were constructed first.<br />
Interactions were introduced on a case-by-case basis to improve model fit and predictive ability.<br />
28


