Prism User's Guide - CSAIL People - MIT
Prism User's Guide - CSAIL People - MIT
Prism User's Guide - CSAIL People - MIT

Create successful ePaper yourself
Turn your PDF publications into a flip-book with our unique Google optimized e-Paper software.
.)<br />
------ p . ....................... ii--- Data------..-------<br />
Chapter 5. Vualizing Data<br />
By default <strong>Prism</strong> uses the entire range of values for all these representations.<br />
Threshold - For threshold representations, use this variable to specify<br />
the value at which <strong>Prism</strong> is to change the display from black to white. Data<br />
elements whose values are at or below the threshold are displayed as<br />
black; data elements whose values are above the threshold are displayed<br />
as white. By default, <strong>Prism</strong> uses the mean of the data as the threshold.<br />
Displaying a Ruler<br />
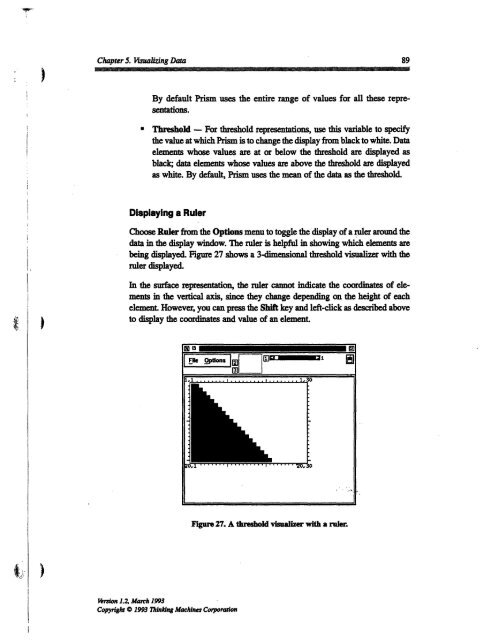
Choose Ruler from the Options menu to toggle the display of a ruler around the<br />
data in the display window. The ruler is helpful in showing which elements are<br />
being displayed. Figure 27 shows a 3-dimensional threshold visualizer with the<br />
ruler displayed.<br />
In the surface representation, the ruler cannot indicate the coordinates of elements<br />
in the vertical axis, since they change depending on the height of each<br />
element. However, you can press the Shift key and left-click as described above<br />
to display the coordinates and value of an element.<br />
Version 1.2, March 1993<br />
Copyright 0 1993 Thinking Machines Corporation<br />
Figure 27. A threshold visualizer with a ruler.<br />
89