Prism User's Guide - CSAIL People - MIT
Prism User's Guide - CSAIL People - MIT
Prism User's Guide - CSAIL People - MIT
You also want an ePaper? Increase the reach of your titles
YUMPU automatically turns print PDFs into web optimized ePapers that Google loves.
Chapter 6. Obtaining Performance Data 113<br />
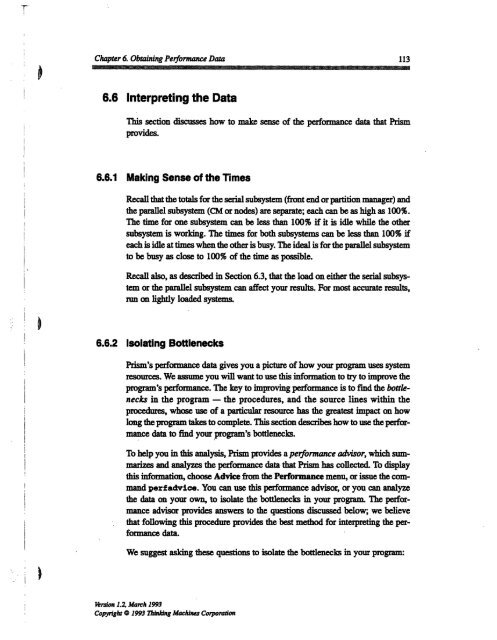
6.6 Interpreting the Data<br />
This section discusses how to make sense of the performance data that <strong>Prism</strong><br />
provides.<br />
6.6.1 Making Sense of the Times<br />
Recall that the totals for the serial subsystem (front end or partition manager) and<br />
the parallel subsystem (CM or nodes) are separate; each can be as high as 100%.<br />
The time for one subsystem can be less than 100% if it is idle while the other<br />
subsystem is worldng. The times for both subsystems can be less than 100% if<br />
each is idle at times when the other is busy. The ideal is for the parallel subsystem<br />
to be busy as close to 100% of the time as possible.<br />
Recall also, as described in Section 6.3, that the load on either the serial subsystem<br />
or the parallel subsystem can affect your results. For most accurate results,<br />
run on lightly loaded systems.<br />
6.6.2 Isolating Bottlenecks<br />
<strong>Prism</strong>'s performance data gives you a picture of how your program uses system<br />
resources. We assume you will want to use this information to try to improve the<br />
program's performance. The key to improving performance is to find the bottlenecks<br />
in the program - the procedures, and the source lines within the<br />
procedures, whose use of a particular resource has the greatest impact on how<br />
long the program takes to complete. This section describes how to use the performance<br />
data to find your program's bottlenecks.<br />
To help you in this analysis, <strong>Prism</strong> provides a performance advisor, which summarizes<br />
and analyzes the performance data that <strong>Prism</strong> has collected. To display<br />
this information, choose Advice from the Performance menu, or issue the command<br />
perfadvice. You can use this performance advisor, or you can analyze<br />
the data on your own, to isolate the bottlenecks in your program. The performance<br />
advisor provides answers to the questions discussed below; we believe<br />
that following this procedure provides the best method for interpreting the performance<br />
data.<br />
We suggest asking these questions to isolate the bottlenecks in your program:<br />
Version 1.2, March 1993<br />
Copyright 0 1993 Thinking Machines Corporation


