Prism User's Guide - CSAIL People - MIT
Prism User's Guide - CSAIL People - MIT
Prism User's Guide - CSAIL People - MIT

You also want an ePaper? Increase the reach of your titles
YUMPU automatically turns print PDFs into web optimized ePapers that Google loves.
90<br />
<strong>Prism</strong> User <strong>Guide</strong><br />
90 - - - - - - - - - - -G-- <strong>Prism</strong>-- -d-<br />
Displaying Statistics<br />
Choose Statistics from the Options menu to display a window containing statistics<br />
and other information about the variable being visualized. The window<br />
contains:<br />
* the name of the variable<br />
* its type and number of dimensions<br />
* the total number of elements the variable contains, and the total number<br />
of active elements, based on the context you set within <strong>Prism</strong> (see the next<br />
section for a discussion of setting the context)<br />
* the variable's minimum, maximum, and mean; these statistics reflect the<br />
context you set for the visualizer<br />
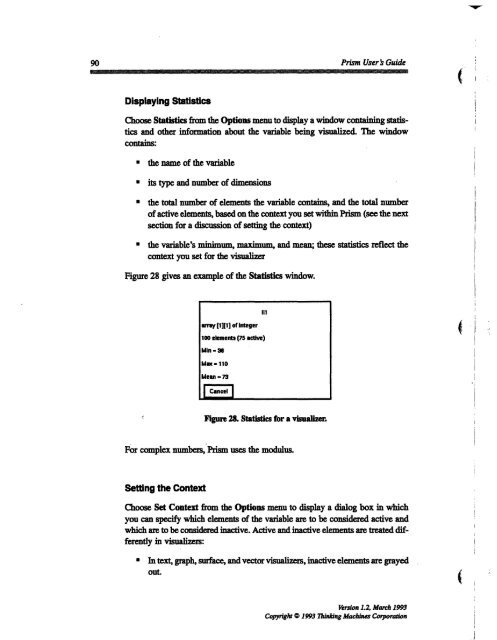
Figure 28 gives an example of the Statistics window.<br />
Figure 28. Statistics for a visualizer.<br />
For complex numbers, <strong>Prism</strong> uses the modulus.<br />
Setting the Context<br />
array [11[1] of Integer<br />
Ill<br />
100 elements (75 active)<br />
Min - 3<br />
Meax- 110<br />
Mean - 73<br />
Choose Set Context from the Options menu to display a dialog box in which<br />
you can specify which elements of the variable are to be considered active and<br />
which are to be considered inactive. Active and inactive elements are treated differently<br />
in visualizers:<br />
* In text, graph, surface, and vector visualizers, inactive elements are grayed<br />
out<br />
Version 1.2, March 1993<br />
Copyright 0 1993 Thining Machines Corporation<br />
(<br />
4<br />
I<br />
I<br />
i<br />
i<br />
I<br />
i<br />
ii<br />
ji<br />
i<br />
I<br />
i<br />
i<br />
i<br />
I<br />
i