Prism User's Guide - CSAIL People - MIT
Prism User's Guide - CSAIL People - MIT
Prism User's Guide - CSAIL People - MIT

Create successful ePaper yourself
Turn your PDF publications into a flip-book with our unique Google optimized e-Paper software.
O i )<br />
Chapter 5. Hsuarliwng Data 85<br />
Chatr. IiiualiINOiiiiiiiii!i<br />
Data!!--- i !' 85--<br />
* Choose Colormap (if you are using a color workstation) to display the<br />
values as a range of colors. By default, <strong>Prism</strong> displays the values as a continuous<br />
spectrum from blue (for the minimum value) to red (for the<br />
maximum value). You can change the colors that <strong>Prism</strong> uses; see Section<br />
9.3.2.<br />
For complex numbers, <strong>Prism</strong> uses the modulus.<br />
* Choose Graph to display values as a graph, with the index of each array<br />
element plotted on the horizontal axis and its value on the vertical axis.<br />
A line connects the points plotted on the graph. This representation is particularly<br />
useful for -dimensional data, but can be used for<br />
higher-dimensional data as well; for example, in a 2-dimensional array,<br />
graphs are shown for each separate 1-dimensional slice-vof the 2-dimensional<br />
plane.<br />
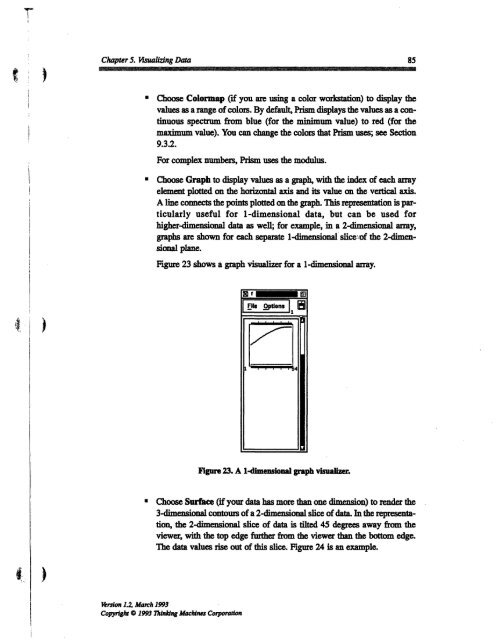
Figure 23 shows a graph visualizer for a -dimensional array.<br />
Figure 23. A 1-dimensional graph visualizer.<br />
a Choose Surface (if your data has more than one dimension) to render the<br />
3-dimensional contours of a 2-dimensional slice of data In the representation,<br />
the 2-dimensional slice of data is tilted 45 degrees away from the<br />
viewer, with the top edge further from the viewer than the bottom edge.<br />
The data values rise out of this slice. Figure 24 is an example.<br />
Version 1.2, March 1993<br />
Copyriglu 0 1993 Thinking Machines Corporation