Prism User's Guide - CSAIL People - MIT
Prism User's Guide - CSAIL People - MIT
Prism User's Guide - CSAIL People - MIT

Create successful ePaper yourself
Turn your PDF publications into a flip-book with our unique Google optimized e-Paper software.
106<br />
~;.. - 5<br />
Y?1<br />
Pamiwc Data E<br />
PM Total 198.7 6 X<br />
Node cpu (user) 1 38.2<br />
Node cpu (system) 1 150.1 X<br />
Comm (Send/Get)<br />
Comm (NEWS)<br />
Comm (Reductions) 0 7.6 X<br />
Corm (PM Node) 10.0 X<br />
Node not profiled<br />
Node I/0<br />
Node+Comm Total I 196.0 X<br />
MAIN Io.1 x<br />
loop I 50.0 X<br />
results<br />
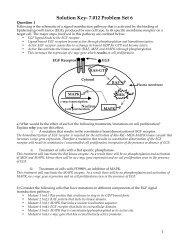
Figure 33. The Performance Data window.<br />
<strong>Prism</strong> User 's <strong>Guide</strong><br />
File Optlons Help Total time: BJ0 a Mode: flat 0<br />
Resources Resource: Node cpu (system)<br />
Procedure: loop<br />
subroutine loop(n, identity, primes, candid)<br />
logical primes(n), candid(n)<br />
integer dentty(n)<br />
integer i. n. nextprime<br />
C<br />
C Loop: Find next valid candidate, mark it as a prime,<br />
C invalidate all multiples as candidates, repeat.<br />
C<br />
nextprime = 2<br />
do while (nextprime le. sqrt(real(n)))<br />
primes(nextprime) = true.<br />
candid(nextprime:n:nextprime) = false. '149.9<br />
nextprime = minval(ldentit, 1. candid)<br />
end do<br />
C<br />
The Performance Data window contains three levels of performance data:<br />
* Performance statistics for the resources that <strong>Prism</strong> measures, along with<br />
totals for each of the two subsystems.<br />
Per-procedure performance statistics for a specified resource or subsystem.<br />
You can choose either flat or call-graph display of these statistics.<br />
Per-source-line performance statistics for a specified resource and<br />
procedure.<br />
All statistics are displayed as histograms in panes within the Performance Data<br />
window, along with the percentage or the amount of time that the histogram bar<br />
represents. If the program didn't use the resource, the histogram bar does not<br />
appear. (Occasionally, however, a resource will show a utilization of 0% because<br />
of rounding.) The total amount of execution time and the display mode for procedures<br />
(flat or call-graph) is displayed at the top of the window.<br />
Version 1.2, March 1993<br />
Copyright C) 1993 Thinking Machines Corporation<br />
I<br />
I<br />
;<br />
(<br />
i<br />
i<br />
I<br />
i<br />
i<br />
i<br />
1I<br />
I<br />
i<br />
i<br />
i<br />
i<br />
ii<br />
i<br />
i