Registration document 2011 - tota - Total.com
Registration document 2011 - tota - Total.com
Registration document 2011 - tota - Total.com

You also want an ePaper? Increase the reach of your titles
YUMPU automatically turns print PDFs into web optimized ePapers that Google loves.
2. Upstream<br />
TOTAL’s Upstream segment includes the Exploration & Production<br />
and Gas & Power divisions.<br />
The Group has exploration and production activities in more than forty<br />
countries and produces oil or gas in approximately thirty countries.<br />
2.35 Mboe/d of hydrocarbons produced in <strong>2011</strong><br />
11.4 Bboe of proved reserves as of December 31, <strong>2011</strong> (1)<br />
Capital expenditure for <strong>2011</strong>: €21.7 billion<br />
23,563 employees<br />
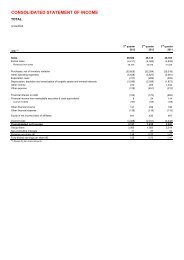
Upstream segment financial data<br />
(M€) <strong>2011</strong> 2010 2009<br />
Non-Group sales 23,298 18,527 16,072<br />
Adjusted operating in<strong>com</strong>e 22,474 17,653 12,879<br />
Adjusted net operating in<strong>com</strong>e 10,405 8,597 6,382<br />
For the full year <strong>2011</strong>, adjusted net operating in<strong>com</strong>e from the<br />
Upstream segment was €10,405 million <strong>com</strong>pared to €8,597 million<br />
in 2010, an increase of 21%. Expressed in dollars, adjusted net<br />
operating in<strong>com</strong>e from the Upstream segment was $14.5 billion,<br />
an increase of 27% <strong>com</strong>pared to 2010, essentially due to the impact<br />
of higher hydrocarbon prices.<br />
Technical costs (2) for consolidated subsidiaries, in accordance with<br />
ASC 932 (3) , were 18.9 $/boe (4) in <strong>2011</strong>, <strong>com</strong>pared to 16.6 $/boe in 2010.<br />
The return on average capital employed (ROACE (5) ) for the Upstream<br />
segment was 20%, for the full-year <strong>2011</strong> <strong>com</strong>pared to 21% for the<br />
full year 2010.<br />
Price realizations (a) <strong>2011</strong> 2010 2009<br />
Average liquids price ($/b) 105.0 76.3 58.1<br />
Average gas price ($/Mbtu) 6.53 5.15 5.17<br />
(a) Consolidated subsidiaries, excluding fixed margin and buyback contracts.<br />
TOTAL’s average liquids price increased by 38% in <strong>2011</strong> <strong>com</strong>pared<br />
to 2010 and TOTAL’s average gas price increased by 27% <strong>com</strong>pared<br />
to 2010.<br />
(1) Based on a Brent crude price of $110.96/b.<br />
(2) (Production costs + exploration expenses + depreciation, depletion and amortization<br />
and valuation allowances)/production of the year.<br />
(3) FASB Accounting Standards Codification Topic 932, Extractive industries – Oil and Gas.<br />
(4) Excluding IAS 36 (impairment of assets).<br />
(5) Calculated based on adjusted net operating in<strong>com</strong>e and average capital employed, using<br />
replacement cost.<br />
(6) Impact of changing hydrocarbon prices on entitlement volumes.<br />
(7) Change in reserves excluding production i.e. (revisions + discoveries, extensions<br />
+ acquisitions – divestments) / production for the period. The reserve replacement rate<br />
would be 84% in an environment with a constant 79.02 $/b oil price, excluding<br />
acquisitions and divestments.<br />
(8) Limited to proved and probable reserves covered by E&P contracts on fields that have<br />
been drilled and for which technical studies have demonstrated economic development<br />
in a 100 $/b Brent environment, including projects developed by mining.<br />
(9) Proved and probable reserves plus contingent resources (potential average recoverable<br />
reserves from known accumulations - Society of Petroleum Engineers - 03/07).<br />
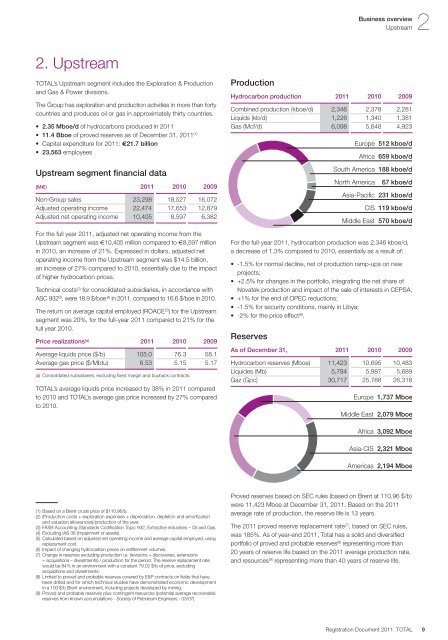
Production<br />
Hydrocarbon production <strong>2011</strong> 2010 2009<br />
Combined production (kboe/d) 2,346 2,378 2,281<br />
Liquids (kb/d) 1,226 1,340 1,381<br />
Gas (Mcf/d) 6,098 5,648 4,923<br />
For the full-year <strong>2011</strong>, hydrocarbon production was 2,346 kboe/d,<br />
a decrease of 1.3% <strong>com</strong>pared to 2010, essentially as a result of:<br />
-1.5% for normal decline, net of production ramp-ups on new<br />
projects;<br />
+2.5% for changes in the portfolio, integrating the net share of<br />
Novatek production and impact of the sale of interests in CEPSA,<br />
+1% for the end of OPEC reductions;<br />
-1.5% for security conditions, mainly in Libya;<br />
-2% for the price effect (6) .<br />
Reserves<br />
Business overview<br />
Upstream 2<br />
Europe 512 kboe/d<br />
Africa 659 kboe/d<br />
South America 188 kboe/d<br />
North America 67 kboe/d<br />
Asia-Pacific 231 kboe/d<br />
CIS 119 kboe/d<br />
Middle East 570 kboe/d<br />
As of December 31, <strong>2011</strong> 2010 2009<br />
Hydrocarbon reserves (Mboe) 11,423 10,695 10,483<br />
Liquides (Mb) 5,784 5,987 5,689<br />
Gaz (Gpc) 30,717 25,788 26,318<br />
Europe 1,737 Mboe<br />
Middle East 2,079 Mboe<br />
Africa 3,092 Mboe<br />
Asia-CIS 2,321 Mboe<br />
Americas 2,194 Mboe<br />
Proved reserves based on SEC rules (based on Brent at 110.96 $/b)<br />
were 11,423 Mboe at December 31, <strong>2011</strong>. Based on the <strong>2011</strong><br />
average rate of production, the reserve life is 13 years.<br />
The <strong>2011</strong> proved reserve replacement rate (7) , based on SEC rules,<br />
was 185%. As of year-end <strong>2011</strong>, <strong>Total</strong> has a solid and diversified<br />
portfolio of proved and probable reserves (8) representing more than<br />
20 years of reserve life based on the <strong>2011</strong> average production rate,<br />
and resources (9) representing more than 40 years of reserve life.<br />
<strong>Registration</strong> Document <strong>2011</strong>. TOTAL 9