Registration document 2011 - tota - Total.com
Registration document 2011 - tota - Total.com
Registration document 2011 - tota - Total.com

You also want an ePaper? Increase the reach of your titles
YUMPU automatically turns print PDFs into web optimized ePapers that Google loves.
12<br />
324<br />
Corporate social responsibility<br />
Employee policy<br />
1. Employee policy<br />
The quantitative information set out below about TOTAL’s employees worldwide relates to all the subsidiaries consolidated under the global<br />
integration method. Some of the data <strong>com</strong>es from the Worldwide Human Resources Survey (WHRS), which uses almost one hundred<br />
indicators measuring important factors of the Group’s employee policy. This annual survey is performed on a sample of employees from the<br />
consolidated <strong>com</strong>panies, representative of their distribution by business segment and region; when such WHRS data is mentioned in this<br />
<strong>document</strong>, reference will be made to the relevant scope.<br />
1.1. Group employee<br />
1.1.1. Group employees<br />
as of December 31, <strong>2011</strong> (1)<br />
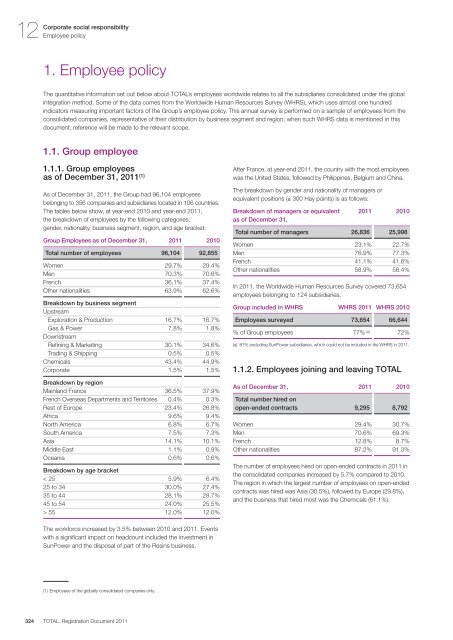
As of December 31, <strong>2011</strong>, the Group had 96,104 employees<br />
belonging to 356 <strong>com</strong>panies and subsidiaries located in 106 countries.<br />
The tables below show, at year-end 2010 and year-end <strong>2011</strong>,<br />
the breakdown of employees by the following categories:<br />
gender, nationality, business segment, region, and age bracket:<br />
Group Employees as of December 31, <strong>2011</strong> 2010<br />
<strong>Total</strong> number of employees 96,104 92,855<br />
Women 29.7% 29.4%<br />
Men 70.3% 70.6%<br />
French 36.1% 37.4%<br />
Other nationalities 63.9% 62.6%<br />
Breakdown by business segment<br />
Upstream<br />
Exploration & Production 16.7% 16.7%<br />
Gas & Power 7.8% 1.8%<br />
Downstream<br />
Refining & Marketing 30.1% 34.6%<br />
Trading & Shipping 0.5% 0.5%<br />
Chemicals 43.4% 44.9%<br />
Corporate 1.5% 1.5%<br />
Breakdown by region<br />
Mainland France 36.5% 37.9%<br />
French Overseas Departments and Territories 0.4% 0.3%<br />
Rest of Europe 23.4% 26.8%<br />
Africa 9.6% 9.4%<br />
North America 6.8% 6.7%<br />
South America 7.5% 7.3%<br />
Asia 14.1% 10.1%<br />
Middle East 1.1% 0.9%<br />
Oceania 0.6% 0.6%<br />
Breakdown by age bracket<br />
< 25 5.9% 6.4%<br />
25 to 34 30.0% 27.4%<br />
35 to 44 28.1% 28.7%<br />
45 to 54 24.0% 25.5%<br />
> 55 12.0% 12.0%<br />
The workforce increased by 3.5% between 2010 and <strong>2011</strong>. Events<br />
with a significant impact on headcount included the investment in<br />
SunPower and the disposal of part of the Resins business.<br />
(1) Employees of the globally consolidated <strong>com</strong>panies only.<br />
TOTAL. <strong>Registration</strong> Document <strong>2011</strong><br />
After France, at year-end <strong>2011</strong>, the country with the most employees<br />
was the United States, followed by Philippines, Belgium and China.<br />
The breakdown by gender and nationality of managers or<br />
equivalent positions (≥ 300 Hay points) is as follows:<br />
Breakdown of managers or equivalent <strong>2011</strong> 2010<br />
as of December 31,<br />
<strong>Total</strong> number of managers 26,836 25,998<br />
Women 23.1% 22.7%<br />
Men 76.9% 77.3%<br />
French 41.1% 41.6%<br />
Other nationalities 58.9% 58.4%<br />
In <strong>2011</strong>, the Worldwide Human Resources Survey covered 73,654<br />
employees belonging to 124 subsidiaries.<br />
Group included in WHRS WHRS <strong>2011</strong> WHRS 2010<br />
Employees surveyed 73,654 66,644<br />
% of Group employees 77% (a) 72%<br />
(a) 81% excluding SunPower subsidiaries, which could not be included in the WHRS in <strong>2011</strong>.<br />
1.1.2. Employees joining and leaving TOTAL<br />
As of December 31, <strong>2011</strong> 2010<br />
<strong>Total</strong> number hired on<br />
open-ended contracts 9,295 8,792<br />
Women 29.4% 30.7%<br />
Men 70.6% 69.3%<br />
French 12.8% 8.7%<br />
Other nationalities 87.2% 91.3%<br />
The number of employees hired on open-ended contracts in <strong>2011</strong> in<br />
the consolidated <strong>com</strong>panies increased by 5.7% <strong>com</strong>pared to 2010.<br />
The region in which the largest number of employees on open-ended<br />
contracts was hired was Asia (30.5%), followed by Europe (29.8%),<br />
and the business that hired most was the Chemicals (61.1%).