Registration document 2011 - tota - Total.com
Registration document 2011 - tota - Total.com
Registration document 2011 - tota - Total.com

Create successful ePaper yourself
Turn your PDF publications into a flip-book with our unique Google optimized e-Paper software.
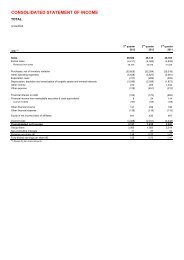
For the year ended December 31, <strong>2011</strong> (adjusted)<br />
(M€) (a) Upstream Downstream Chemicals Corporate Inter<strong>com</strong>pany <strong>Total</strong><br />
Non-Group sales 23,253 141,907 19,477 11 - 184,648<br />
Intersegment sales 27,301 5,983 1,234 185 (34,703) -<br />
Excise taxes - (18,143) - - - (18,143)<br />
Revenues from sales 50,554 129,747 20,711 196 (34,703) 166,505<br />
Operating expenses (23,079) (127,301) (19,533) (667) 34,703 (135,877)<br />
Depreciation, depletion and amortization<br />
of tangible assets and mineral interests (5,001) (1,208) (481) (35) - (6,725)<br />
Adjusted operating in<strong>com</strong>e 22,474 1,238 697 (506) - 23,903<br />
Equity in in<strong>com</strong>e (loss) of affiliates and other items 1,405 145 262 246 - 2,058<br />
Tax on net operating in<strong>com</strong>e (13,474) (300) (184) 42 - (13,916)<br />
Adjusted net operating in<strong>com</strong>e 10,405 1,083 775 (218) - 12,045<br />
Net cost of net debt - - - - - (335)<br />
Non-controlling interests - - - - - (286)<br />
Adjusted net in<strong>com</strong>e - - - - - 11,424<br />
Adjusted fully-diluted earnings per share (€) - - - - - 5.06<br />
(a) Except for earnings per share.<br />
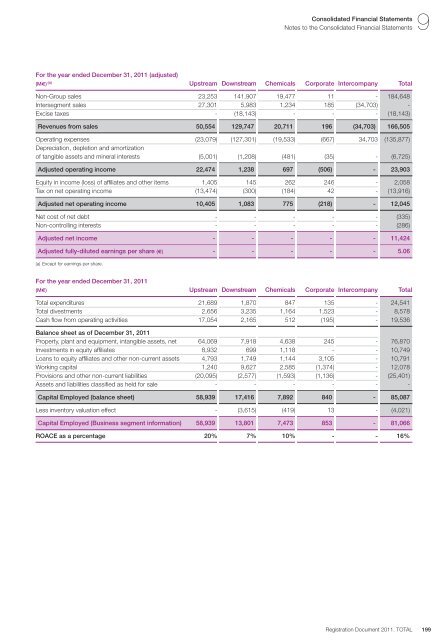
For the year ended December 31, <strong>2011</strong><br />
Consolidated Financial Statements 9<br />
Notes to the Consolidated Financial Statements<br />
(M€) Upstream Downstream Chemicals Corporate Inter<strong>com</strong>pany <strong>Total</strong><br />
<strong>Total</strong> expenditures 21,689 1,870 847 135 - 24,541<br />
<strong>Total</strong> divestments 2,656 3,235 1,164 1,523 - 8,578<br />
Cash flow from operating activities 17,054 2,165 512 (195) - 19,536<br />
Balance sheet as of December 31, <strong>2011</strong><br />
Property, plant and equipment, intangible assets, net 64,069 7,918 4,638 245 - 76,870<br />
Investments in equity affiliates 8,932 699 1,118 - - 10,749<br />
Loans to equity affiliates and other non-current assets 4,793 1,749 1,144 3,105 - 10,791<br />
Working capital 1,240 9,627 2,585 (1,374) - 12,078<br />
Provisions and other non-current liabilities (20,095) (2,577) (1,593) (1,136) - (25,401)<br />
Assets and liabilities classified as held for sale - - - - - -<br />
Capital Employed (balance sheet) 58,939 17,416 7,892 840 - 85,087<br />
Less inventory valuation effect - (3,615) (419) 13 - (4,021)<br />
Capital Employed (Business segment information) 58,939 13,801 7,473 853 - 81,066<br />
ROACE as a percentage 20% 7% 10% - - 16%<br />
<strong>Registration</strong> Document <strong>2011</strong>. TOTAL<br />
199