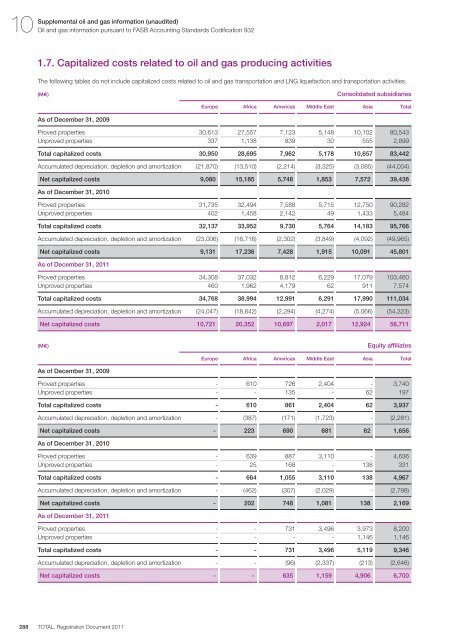
10 288 Supplemental oil and gas information (unaudited) Oil and gas information pursuant to FASB Accounting Standards Codification 932 1.7. Capitalized costs related to oil and gas producing activities The following tables do not include capitalized costs related to oil and gas transportation and LNG liquefaction and transportation activities. (M€) Consolidated subsidiaries As of December 31, 2009 Proved properties 30,613 27,557 7,123 5,148 10,102 80,543 Unproved properties 337 1,138 839 30 555 2,899 <strong>Total</strong> capitalized costs 30,950 28,695 7,962 5,178 10,657 83,442 Accumulated depreciation, depletion and amortization (21,870) (13,510) (2,214) (3,325) (3,085) (44,004) Net capitalized costs 9,080 15,185 5,748 1,853 7,572 39,438 As of December 31, 2010 Proved properties 31,735 32,494 7,588 5,715 12,750 90,282 Unproved properties 402 1,458 2,142 49 1,433 5,484 <strong>Total</strong> capitalized costs 32,137 33,952 9,730 5,764 14,183 95,766 Accumulated depreciation, depletion and amortization (23,006) (16,716) (2,302) (3,849) (4,092) (49,965) Net capitalized costs 9,131 17,236 7,428 1,915 10,091 45,801 As of December 31, <strong>2011</strong> Proved properties 34,308 37,032 8,812 6,229 17,079 103,460 Unproved properties 460 1,962 4,179 62 911 7,574 <strong>Total</strong> capitalized costs 34,768 38,994 12,991 6,291 17,990 111,034 Accumulated depreciation, depletion and amortization (24,047) (18,642) (2,294) (4,274) (5,066) (54,323) Net capitalized costs 10,721 20,352 10,697 2,017 12,924 56,711 As of December 31, 2009 Proved properties - 610 726 2,404 - 3,740 Unproved properties - - 135 - 62 197 <strong>Total</strong> capitalized costs - 610 861 2,404 62 3,937 Accumulated depreciation, depletion and amortization - (387) (171) (1,723) - (2,281) Net capitalized costs - 223 690 681 62 1,656 As of December 31, 2010 Proved properties - 639 887 3,110 - 4,636 Unproved properties - 25 168 - 138 331 <strong>Total</strong> capitalized costs - 664 1,055 3,110 138 4,967 Accumulated depreciation, depletion and amortization - (462) (307) (2,029) - (2,798) Net capitalized costs - 202 748 1,081 138 2,169 As of December 31, <strong>2011</strong> Europe Africa Americas Middle East Asia <strong>Total</strong> (M€) Equity affiliates Europe Africa Americas Middle East Asia <strong>Total</strong> Proved properties - - 731 3,496 3,973 8,200 Unproved properties - - - - 1,146 1,146 <strong>Total</strong> capitalized costs - - 731 3,496 5,119 9,346 Accumulated depreciation, depletion and amortization - - (96) (2,337) (213) (2,646) Net capitalized costs - - 635 1,159 4,906 6,700 TOTAL. <strong>Registration</strong> Document <strong>2011</strong>
The standardized measure of discounted future net cash flows relating to proved oil and gas reserve quantities was developed as follows: – estimates of proved reserves and the corresponding production profiles are based on existing technical and economic conditions; – the estimated future cash flows are determined based on prices used in estimating the Group’s proved oil and gas reserves; – the future cash flows incorporate estimated production costs (including production taxes), future development costs and asset retirement costs. All cost estimates are based on year-end technical and economic conditions; (M€) Consolidated subsidiaries As of December 31, 2009 Future cash inflows 50,580 107,679 18,804 9,013 32,004 218,080 Future production costs (11,373) (23,253) (8,286) (2,831) (6,996) (52,739) Future development costs (12,795) (21,375) (5,728) (698) (6,572) (47,168) Future in<strong>com</strong>e taxes (17,126) (36,286) (1,293) (2,041) (5,325) (62,071) Future net cash flows, after in<strong>com</strong>e taxes 9,286 26,765 3,497 3,443 13,111 56,102 Discount at 10% (3,939) (13,882) (2,696) (1,558) (8,225) (30,300) Standardized measure of discounted future net cash flows 5,347 12,883 801 1,885 4,886 25,802 As of December 31, 2010 Future cash inflows 65,644 142,085 42,378 14,777 41,075 305,959 Future production costs (16,143) (29,479) (19,477) (4,110) (6,476) (75,685) Future development costs (18,744) (25,587) (8,317) (3,788) (8,334) (64,770) Future in<strong>com</strong>e taxes (20,571) (51,390) (3,217) (2,541) (7,281) (85,000) Future net cash flows, after in<strong>com</strong>e taxes 10,186 35,629 11,367 4,338 18,984 80,504 Discount at 10% (5,182) (16,722) (8,667) (2,106) (11,794) (44,471) Standardized measure of discounted future net cash flows 5,004 18,907 2,700 2,232 7,190 36,033 As of December 31, <strong>2011</strong> Future cash inflows 85,919 167,367 53,578 14,297 67,868 389,029 Future production costs (18,787) (31,741) (22,713) (3,962) (12,646) (89,849) Future development costs (21,631) (22,776) (11,548) (3,110) (11,044) (70,109) Future in<strong>com</strong>e taxes (28,075) (71,049) (4,361) (2,794) (12,963) (119,242) Future net cash flows, after in<strong>com</strong>e taxes 17,426 41,801 14,956 4,431 31,215 109,829 Discount at 10% (9,426) (17,789) (12,298) (2,186) (20,717) (62,416) Standardized measure of discounted future net cash flows 8,000 24,012 2,658 2,245 10,498 47,413 Minority interests in future net cash flows as of (M€) Supplemental oil and gas information (unaudited) 10 Oil and gas information pursuant to FASB Accounting Standards Codification 932 1.8. Standardized measure of discounted future net cash flows (excluding transportation) – future in<strong>com</strong>e taxes are <strong>com</strong>puted by applying the year-end statutory tax rate to future net cash flows after consideration of permanent differences and future in<strong>com</strong>e tax credits; and – future net cash flows are discounted at a standard discount rate of 10 percent. These principles applied are those required by ASC 932 and do not reflect the expectations of real revenues from these reserves, nor their present value; hence, they do not constitute criteria for investment decisions. An estimate of the fair value of reserves should also take into account, among other things, the recovery of reserves not presently classified as proved, anticipated future changes in prices and costs and a discount factor more representative of the time value of money and the risks inherent in reserves estimates. Europe Africa Americas Middle East Asia <strong>Total</strong> December 31, 2009 212 60 - - - 272 December 31, 2010 273 344 - - - 617 December 31, <strong>2011</strong> - 558 - - - 558 <strong>Registration</strong> Document <strong>2011</strong>. TOTAL 289
- Page 1 and 2:
Registration Document 2011
- Page 3 and 4:
Registration Document 2011 This tra
- Page 5 and 6:
Key figures 1. Operating and market
- Page 7 and 8:
Sales Adjusted net income (Group sh
- Page 9 and 10:
Shareholder base Estimates as of No
- Page 11 and 12:
Business overview Business overview
- Page 13 and 14:
2. Upstream TOTAL’s Upstream segm
- Page 15 and 16:
As of December 31, 2009, TOTAL’s
- Page 17 and 18:
2.3. Presentation of production act
- Page 19 and 20:
Indonesia 1968 Myanmar 1992 Thailan
- Page 21 and 22:
United Kingdom 1962 Middle East U.A
- Page 23 and 24:
In Kenya, TOTAL acquired in Septemb
- Page 25 and 26:
In the United States, the Group’s
- Page 27 and 28:
The next two wells, which were expl
- Page 29 and 30:
is expected to be transported to Ru
- Page 31 and 32:
- In addition to Alwyn and the Cent
- Page 33 and 34:
2.6. Number of net oil and gas well
- Page 35 and 36:
Asia Yadana Yadana (Myanmar) Ban-I
- Page 37 and 38:
2.9.3. Marketing To unlock value fr
- Page 39 and 40:
As of January 2012, TOTAL owns 66%
- Page 41 and 42:
3. Downstream The Downstream segmen
- Page 43 and 44:
The heavy conversion process of thi
- Page 45 and 46:
In Northern, Central and Eastern Eu
- Page 47 and 48:
The oil markets had ended 2010 sign
- Page 49 and 50:
4.1. Base Chemicals The Base Chemic
- Page 51 and 52:
4.1.2. Fertilizers Through its Fren
- Page 53 and 54:
5. Investments 5.1. Major investmen
- Page 55 and 56:
7. Property, plant and equipment TO
- Page 57 and 58:
Finance Refining & Marketing Financ
- Page 59 and 60:
Crude Oil Trading Finance Trading &
- Page 61 and 62:
Management Report The Management re
- Page 63 and 64:
- a Refining & Chemicals segment, a
- Page 65 and 66:
1.2.4. Investments - divestments In
- Page 67 and 68:
1.6. TOTAL S.A. 2011 results Net in
- Page 69 and 70:
2.5. Anticipated sources of financi
- Page 71 and 72:
3.6. Environment Environmental issu
- Page 73 and 74:
Risk factors Risk factors 4 1. Fina
- Page 75 and 76:
Trading & Shipping : value-at-risk
- Page 77 and 78:
1.8. Sensitivity analysis on intere
- Page 79 and 80:
1.10. Liquidity risk TOTAL S.A. has
- Page 81 and 82:
Customer receivables are subject to
- Page 83 and 84:
2.2. Management and monitoring of i
- Page 85 and 86:
egions, causing substantial decline
- Page 87 and 88:
3.4. Activities in Cuba, Iran, Suda
- Page 89 and 90:
and service contracts. In 2011, TOT
- Page 91 and 92:
4.3. Insurance policy The Group has
- Page 93 and 94:
Corporate governance Corporate gove
- Page 95 and 96:
Chairman of the Nominating & Govern
- Page 97 and 98:
- Permanent representative of Colam
- Page 99 and 100:
du Territoire et de l’Action Rég
- Page 101 and 102:
- Director of Europalia Internation
- Page 103 and 104:
- monitoring the quality of the inf
- Page 105 and 106:
6. COMMITTEES OF THE BOARD OF DIREC
- Page 107 and 108:
1.5.2. Compensation Committee Rules
- Page 109 and 110:
The term of office of the members o
- Page 111 and 112:
- examination of ethical issues (co
- Page 113 and 114:
1.8. Director independence At its m
- Page 115 and 116:
With regard to counterparty risks,
- Page 117 and 118:
Variable compensation is determined
- Page 119 and 120:
3. General Management 3.1. Manageme
- Page 121 and 122:
4.4. Fees received by the statutory
- Page 123 and 124:
total gross compensation as Chairma
- Page 125 and 126:
Chairman and Chief Executive Office
- Page 127 and 128:
The acquisition rate: - is equal to
- Page 129 and 130:
5.7.3. Directors’ fees and other
- Page 131 and 132:
5.8. TOTAL stock option grants Corp
- Page 133 and 134:
If all the outstanding stock option
- Page 135 and 136:
Corporate governance 5 Compensation
- Page 137 and 138:
The grant of these performance shar
- Page 139 and 140:
6. Employees, share ownership 6.1.
- Page 141 and 142:
6.3.1. Summary of transactions in t
- Page 143 and 144:
TOTAL and its shareholders TOTAL an
- Page 145 and 146:
1.2. Share performance TOTAL share
- Page 147 and 148:
1.2.7. TOTAL share price over the p
- Page 149 and 150:
2.2. Dividend payment BNP Paribas S
- Page 151 and 152:
the Board of Directors decided on J
- Page 153 and 154:
- delivered to the holders of secur
- Page 155 and 156:
4.4. Major shareholders 4.4.1. Chan
- Page 157 and 158:
4.6. Shares held by members of the
- Page 159 and 160:
However, there are certain exceptio
- Page 161 and 162:
6.4. Registered shareholding TOTAL
- Page 163 and 164:
Financial information Financial inf
- Page 165 and 166:
4. Dividend policy The Company’s
- Page 167 and 168:
criminal chamber of the Court of Ap
- Page 169 and 170:
In October 2010, the Prosecutor’s
- Page 171 and 172:
General information General informa
- Page 173 and 174:
delegations of authority granted by
- Page 175 and 176:
1.4. Potential share capital as of
- Page 177 and 178:
2.3. Provisions of the by-laws gove
- Page 179 and 180:
2.6. Shareholders’ meetings 2.6.1
- Page 181 and 182:
In 2011, TOTAL’s holdings in Sano
- Page 183 and 184:
Consolidated Financial Statements T
- Page 185 and 186:
2. Consolidated statement of income
- Page 187 and 188:
4. Consolidated balance sheet TOTAL
- Page 189 and 190:
6. Consolidated statement of change
- Page 191 and 192:
Non-monetary contributions by ventu
- Page 193 and 194:
Intangible assets are carried at co
- Page 195 and 196:
when market data are not directly a
- Page 197 and 198:
- In June 2011, the IASB issued rev
- Page 199 and 200:
Since the acquisition date, sales a
- Page 201 and 202:
4) Business segment information Fin
- Page 203 and 204:
For the year ended December 31, 201
- Page 205 and 206:
For the year ended December 31, 201
- Page 207 and 208:
For the year ended December 31, 200
- Page 209 and 210:
For the year ended December 31, 201
- Page 211 and 212:
Adjustments to net income, Group sh
- Page 213 and 214:
7) Other income and other expense F
- Page 215 and 216:
The net deferred tax variation in t
- Page 217 and 218:
11) Property, plant and equipment C
- Page 219 and 220:
12) Equity affiliates: investments
- Page 221 and 222:
In Group share, the main financial
- Page 223 and 224:
15) Inventories As of December 31,
- Page 225 and 226:
17) Shareholders’ equity Number o
- Page 227 and 228:
As of December 31, 2011, paid-in su
- Page 229 and 230:
The experience actuarial (gains) lo
- Page 231 and 232:
19) Provisions and other non-curren
- Page 233 and 234:
20) Financial debt and related fina
- Page 235 and 236:
Bonds after fair value hedge (M€)
- Page 237 and 238:
Bonds after cash flow hedge and fix
- Page 239 and 240:
C) Net-debt-to-equity ratio For its
- Page 241 and 242: 23) Commitments and contingencies A
- Page 243 and 244: guarantees. As of December 31, 2011
- Page 245 and 246: 25) Share-based payments A) TOTAL s
- Page 247 and 248: condition. This condition states th
- Page 249 and 250: - varies on a straight-line basis b
- Page 251 and 252: The following table summarizes SunP
- Page 253 and 254: 27) Statement of cash flows A) Cash
- Page 255 and 256: As of December 31, 2010 (M€) Asse
- Page 257 and 258: Assets and liabilities from financi
- Page 259 and 260: As of December 31, 2010 (M€) Asse
- Page 261 and 262: D) Fair value hierarchy The fair va
- Page 263 and 264: As of December 31, 2009 Consolidate
- Page 265 and 266: As part of its gas, power and coal
- Page 267 and 268: As a result of this policy, the imp
- Page 269 and 270: The following table sets forth fina
- Page 271 and 272: its assets (as calculated under the
- Page 273 and 274: e paid to those affected by the pol
- Page 275 and 276: 33) Other information Research and
- Page 277 and 278: The business segments are identifie
- Page 279 and 280: Supplemental oil and gas informatio
- Page 281 and 282: 1.3. Proved undeveloped reserves As
- Page 283 and 284: (in million barrels of oil equivale
- Page 285 and 286: Supplemental oil and gas informatio
- Page 287 and 288: 1.4.4. Changes in gas reserves Supp
- Page 289 and 290: 1.5. Results of operations for oil
- Page 291: 1.6. Cost incurred The following ta
- Page 295 and 296: 1.9. Changes in the standardized me
- Page 297 and 298: 2011 Natural gas production availab
- Page 299 and 300: TOTAL S.A. The statutory Financial
- Page 301 and 302: To be eligible for this supplementa
- Page 303 and 304: 3. Statutory Financial Statements o
- Page 305 and 306: 3.3. Statement of cash flow For the
- Page 307 and 308: 4. Notes to the Statutory Financial
- Page 309 and 310: 4) Other non-current assets A) Chan
- Page 311 and 312: TOTAL shares held by the Group subs
- Page 313 and 314: 11) Translation adjustment The appl
- Page 315 and 316: 21) Commitments As of December 31 (
- Page 317 and 318: - is equal to 100% if the average R
- Page 319 and 320: D) TOTAL performance share grant Th
- Page 321 and 322: 24) Others Compensation for the adm
- Page 323 and 324: 5.2. Five-year financial data Share
- Page 325 and 326: 6. Consolidated financial informati
- Page 327 and 328: Corporate social responsibility Cor
- Page 329 and 330: TOTAL also hired 3,321 employees on
- Page 331 and 332: 1.5. Equal opportunity From recruit
- Page 333 and 334: 2.1. Occupational health and safety
- Page 335 and 336: TOTAL particularly monitors hazardo
- Page 337 and 338: The Group has therefore taken proac
- Page 339 and 340: Social and economic development of
- Page 341 and 342: commitment for TOTAL, adopting a pr
- Page 343 and 344:
4.3. TOTAL and new energies Althoug
- Page 345 and 346:
The selected sites and subsidiaries
- Page 347 and 348:
Assurance Opinion Completeness of d
- Page 349 and 350:
Glossary A Acreage Areas in which m
- Page 351 and 352:
MTO/OCP MTO (Methanols to Olefins)
- Page 353 and 354:
Cross reference lists Registration
- Page 355 and 356:
17. Employees 17.1. Number of emplo
- Page 357 and 358:
Registration Document concordance t
- Page 359 and 360:
PEFC/10-31-2043 This brochure is pr