Registration document 2011 - tota - Total.com
Registration document 2011 - tota - Total.com
Registration document 2011 - tota - Total.com

Create successful ePaper yourself
Turn your PDF publications into a flip-book with our unique Google optimized e-Paper software.
3 Management<br />
62<br />
Report<br />
Summary of results and financial position<br />
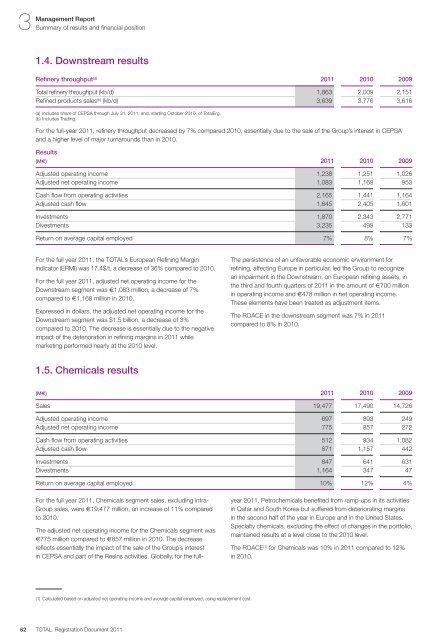
1.4. Downstream results<br />
Refinery throughput (a) <strong>2011</strong> 2010 2009<br />
<strong>Total</strong> refinery throughput (kb/d) 1,863 2,009 2,151<br />
Refined products sales (b) (kb/d) 3,639 3,776 3,616<br />
(a) Includes share of CEPSA through July 31, <strong>2011</strong>, and, starting October 2010, of <strong>Total</strong>Erg.<br />
(b) Includes Trading.<br />
For the full-year <strong>2011</strong>, refinery throughput decreased by 7% <strong>com</strong>pared 2010, essentially due to the sale of the Group’s interest in CEPSA<br />
and a higher level of major turnarounds than in 2010.<br />
Results<br />
(M€) <strong>2011</strong> 2010 2009<br />
Adjusted operating in<strong>com</strong>e 1,238 1,251 1,026<br />
Adjusted net operating in<strong>com</strong>e 1,083 1,168 953<br />
Cash flow from operating activities 2,165 1,441 1,164<br />
Adjusted cash flow 1,645 2,405 1,601<br />
Investments 1,870 2,343 2,771<br />
Divestments 3,235 499 133<br />
Return on average capital employed 7% 8% 7%<br />
For the full year <strong>2011</strong>, the TOTAL’s European Refining Margin<br />
indicator (ERMI) was 17.4$/t, a decrease of 36% <strong>com</strong>pared to 2010.<br />
For the full year <strong>2011</strong>, adjusted net operating in<strong>com</strong>e for the<br />
Downstream segment was €1,083 million, a decrease of 7%<br />
<strong>com</strong>pared to €1,168 million in 2010.<br />
Expressed in dollars, the adjusted net operating in<strong>com</strong>e for the<br />
Downstream segment was $1.5 billion, a decrease of 3%<br />
<strong>com</strong>pared to 2010. The decrease is essentially due to the negative<br />
impact of the deterioration in refining margins in <strong>2011</strong> while<br />
marketing performed nearly at the 2010 level.<br />
1.5. Chemicals results<br />
The persistence of an unfavorable economic environment for<br />
refining, affecting Europe in particular, led the Group to recognize<br />
an impairment in the Downstream, on European refining assets, in<br />
the third and fourth quarters of <strong>2011</strong> in the amount of €700 million<br />
in operating in<strong>com</strong>e and €478 million in net operating in<strong>com</strong>e.<br />
These elements have been treated as adjustment items.<br />
The ROACE in the downstream segment was 7% in <strong>2011</strong><br />
<strong>com</strong>pared to 8% in 2010.<br />
(M€) <strong>2011</strong> 2010 2009<br />
Sales 19,477 17,490 14,726<br />
Adjusted operating in<strong>com</strong>e 697 893 249<br />
Adjusted net operating in<strong>com</strong>e 775 857 272<br />
Cash flow from operating activities 512 934 1,082<br />
Adjusted cash flow 871 1,157 442<br />
Investments 847 641 631<br />
Divestments 1,164 347 47<br />
Return on average capital employed 10% 12% 4%<br />
For the full year <strong>2011</strong>, Chemicals segment sales, excluding intra-<br />
Group sales, were €19,477 million, an increase of 11% <strong>com</strong>pared<br />
to 2010.<br />
The adjusted net operating in<strong>com</strong>e for the Chemicals segment was<br />
€775 million <strong>com</strong>pared to €857 million in 2010. The decrease<br />
reflects essentially the impact of the sale of the Group’s interest<br />
in CEPSA and part of the Resins activities. Globally, for the full-<br />
(1) Calculated based on adjusted net operating in<strong>com</strong>e and average capital employed, using replacement cost.<br />
TOTAL. <strong>Registration</strong> Document <strong>2011</strong><br />
year <strong>2011</strong>, Petrochemicals benefited from ramp-ups in its activities<br />
in Qatar and South Korea but suffered from deteriorating margins<br />
in the second half of the year in Europe and in the United States.<br />
Specialty chemicals, excluding the effect of changes in the portfolio,<br />
maintained results at a level close to the 2010 level.<br />
The ROACE (1) for Chemicals was 10% in <strong>2011</strong> <strong>com</strong>pared to 12%<br />
in 2010.