entire - Deutsche Bank Annual Report 2012
entire - Deutsche Bank Annual Report 2012
entire - Deutsche Bank Annual Report 2012

Create successful ePaper yourself
Turn your PDF publications into a flip-book with our unique Google optimized e-Paper software.
<strong>Deutsche</strong> <strong>Bank</strong> 02 – Consolidated Financial Statements 251<br />
Financial <strong>Report</strong> 2010 Notes to the Consolidated Balance Sheet<br />
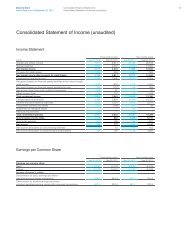
14 – Financial Instruments carried at Fair Value<br />
Dec 31, 2009 Balance,<br />
in € m.<br />
Financial assets held at fair value:<br />
beginning<br />
of year<br />
Total<br />
gains/losses 1<br />
Purchases Sales Issuances 5 Settlements 6<br />
Transfers<br />
into<br />
Level 3<br />
Transfers<br />
out of<br />
Level 3<br />
Balance,<br />
end of year<br />
Trading securities<br />
Positive market values from derivative<br />
17,268 (2,304) 2,883 (5,084) – (1,570) 8,410 (3,994) 15,609<br />
financial instruments 48,792 (15,563) 7<br />
– – – (6,397) 7,510 (9,131) 25,211<br />
Other trading assets<br />
Financial assets designated at fair<br />
13,560 1,832 1,919 (3,057) 246 (3,184) 2,309 (2,843) 10,782<br />
value through profit or loss 5,805 1,507 222 (60) 952 (5,267) 695 (444) 3,410<br />
Financial assets available for sale 1,450 (221) 2<br />
136 (143) – (97) 2,135 (93) 3,167<br />
Other financial assets at fair value 788 70 9 – – – – (826) 41<br />
Total financial assets held at fair value 87,663 (14,679) 3,4<br />
Financial liabilities held at fair value:<br />
5,169 (8,344) 1,198 (16,515) 21,059 (17,331) 58,220<br />
Trading securities<br />
Negative market values from derivative<br />
666 26 – – – 113 186 (560) 431<br />
financial instruments 28,738 (4,374) 7<br />
– – – (5,546) 5,034 (8,261) 15,591<br />
Other trading liabilities<br />
Financial liabilities designated at fair<br />
174 68 – – – 205 – (164) 283<br />
value through profit or loss: 6,030 (1,753) – – 208 (269) 1,443 (3,038) 2,621<br />
Other financial liabilities at fair value (1,249) 649 – – – 93 (253) 3 (757)<br />
Total financial liabilities held at fair value 34,359 (5,384) 3,4<br />
– – 208 (5,404) 6,410 (12,020) 18,169<br />
1 Total gains and losses predominantly relate to net gains (losses) on financial assets/liabilities at fair value through profit or loss reported in the consolidated statement of income.<br />
The balance also includes net gains (losses) on financial assets available for sale reported in the consolidated statement of income and unrealized net gains (losses) on financial assets<br />
available for sale and exchange rate changes reported in other comprehensive income, net of tax.<br />
2 Total gains and losses on available for sale include a gain of € 177 million recognized in other comprehensive income, net of tax, and a loss of € 398 million recognized in the income<br />
statement presented in net gains (losses) on financial assets available for sale.<br />
3 This amount includes the effect of exchange rate changes. For total financial assets held at fair value this effect is a positive € 6.6 billion and for total financial liabilities held at fair value this is<br />
a negative € 2.3 billion. This predominately relates to derivatives. The effect of exchange rate changes is reported in other comprehensive income, net of tax.<br />
4 For assets positive balances represent gains, negative balances represent losses. For liabilities positive balances represent losses, negative balances represent gains.<br />
5 Issuances relate to the cash amount received on the issuance of a liability and the cash amount paid on the primary issuance of a loan to a borrower.<br />
6 Settlements represent cash flows to settle the asset or liability. For debt and loan instruments this includes principal on maturity, principal amortizations and principal repayments.<br />
For derivatives all cash flows are presented in settlements.<br />
7 The gains and losses on derivatives arise as a result of changes to input parameters, in particular tightening of credit spreads.<br />
Sensitivity Analysis of Unobservable Parameters<br />
Where the value of financial instruments is dependent on unobservable parameter inputs, the precise level for<br />
these parameters at the balance sheet date might be drawn from a range of reasonably possible alternatives.<br />
In preparing the financial statements, appropriate levels for these unobservable input parameters are chosen<br />
so that they are consistent with prevailing market evidence and in line with the Group’s approach to valuation<br />
control detailed above. Were the Group to have marked the financial instruments concerned using parameter<br />
values drawn from the extremes of the ranges of reasonably possible alternatives then as of December 31,<br />
2010, it could have increased fair value by as much as € 3.6 billion or decreased fair value by as much as<br />
€ 3.9 billion. As of December 31, 2009, it could have increased fair value by as much as € 4.3 billion or<br />
decreased fair value by as much as € 3.9 billion. In estimating these impacts, the Group either re-valued<br />
certain financial instruments using reasonably possible alternative parameter values, or used an approach<br />
based on its valuation adjustment methodology for bid/offer spread valuation adjustments. Bid/offer spread<br />
valuation adjustments reflect the amount that must be paid in order to close out a holding in an instrument or<br />
component risk and as such they reflect factors such as market illiquidity and uncertainty.