Management of rice production systems to increase productivity
Management of rice production systems to increase productivity
Management of rice production systems to increase productivity
You also want an ePaper? Increase the reach of your titles
YUMPU automatically turns print PDFs into web optimized ePapers that Google loves.
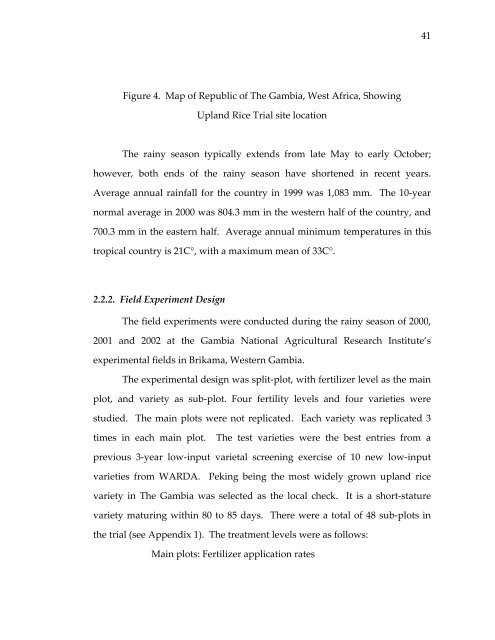
Figure 4. Map <strong>of</strong> Republic <strong>of</strong> The Gambia, West Africa, Showing<br />
Upland Rice Trial site location<br />
The rainy season typically extends from late May <strong>to</strong> early Oc<strong>to</strong>ber;<br />
however, both ends <strong>of</strong> the rainy season have shortened in recent years.<br />
Average annual rainfall for the country in 1999 was 1,083 mm. The 10‐year<br />
normal average in 2000 was 804.3 mm in the western half <strong>of</strong> the country, and<br />
700.3 mm in the eastern half. Average annual minimum temperatures in this<br />
tropical country is 21C°, with a maximum mean <strong>of</strong> 33C°.<br />
2.2.2. Field Experiment Design<br />
The field experiments were conducted during the rainy season <strong>of</strong> 2000,<br />
2001 and 2002 at the Gambia National Agricultural Research Institute’s<br />
experimental fields in Brikama, Western Gambia.<br />
The experimental design was split‐plot, with fertilizer level as the main<br />
plot, and variety as sub‐plot. Four fertility levels and four varieties were<br />
studied. The main plots were not replicated. Each variety was replicated 3<br />
times in each main plot. The test varieties were the best entries from a<br />
previous 3‐year low‐input varietal screening exercise <strong>of</strong> 10 new low‐input<br />
varieties from WARDA. Peking being the most widely grown upland <strong>rice</strong><br />
variety in The Gambia was selected as the local check. It is a short‐stature<br />
variety maturing within 80 <strong>to</strong> 85 days. There were a <strong>to</strong>tal <strong>of</strong> 48 sub‐plots in<br />
the trial (see Appendix 1). The treatment levels were as follows:<br />
Main plots: Fertilizer application rates<br />
41


