Management of rice production systems to increase productivity
Management of rice production systems to increase productivity
Management of rice production systems to increase productivity
Create successful ePaper yourself
Turn your PDF publications into a flip-book with our unique Google optimized e-Paper software.
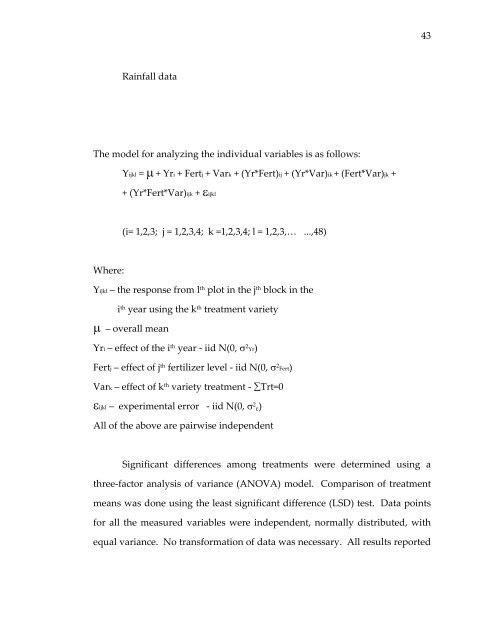
Rainfall data<br />
The model for analyzing the individual variables is as follows:<br />
Where:<br />
Yijkl = μ + Yri + Fertj + Vark + (Yr*Fert)ij + (Yr*Var)ik + (Fert*Var)jk +<br />
+ (Yr*Fert*Var)ijk + εijkl<br />
(i= 1,2,3; j = 1,2,3,4; k =1,2,3,4; l = 1,2,3,… ...,48)<br />
Yijkl – the response from l th plot in the j th block in the<br />
i th year using the k th treatment variety<br />
μ – overall mean<br />
Yri – effect <strong>of</strong> the i th year ‐ iid N(0, σ 2 Yr)<br />
Fertj – effect <strong>of</strong> j th fertilizer level ‐ iid N(0, σ 2 Fert)<br />
Vark – effect <strong>of</strong> k th variety treatment ‐ ∑Trt=0<br />
εijkl – experimental error ‐ iid N(0, σ 2 ε)<br />
All <strong>of</strong> the above are pairwise independent<br />
Significant differences among treatments were determined using a<br />
three‐fac<strong>to</strong>r analysis <strong>of</strong> variance (ANOVA) model. Comparison <strong>of</strong> treatment<br />
means was done using the least significant difference (LSD) test. Data points<br />
for all the measured variables were independent, normally distributed, with<br />
equal variance. No transformation <strong>of</strong> data was necessary. All results reported<br />
43


