nicole kotras masters thesis
nicole kotras masters thesis
nicole kotras masters thesis

Create successful ePaper yourself
Turn your PDF publications into a flip-book with our unique Google optimized e-Paper software.
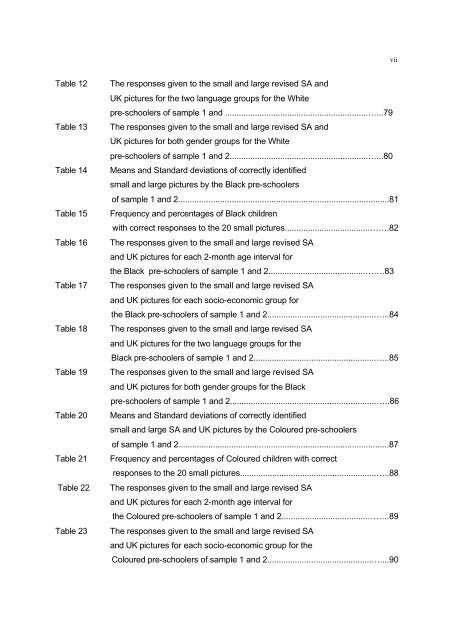
Table 12 The responses given to the small and large revised SA and<br />
UK pictures for the two language groups for the White<br />
pre-schoolers of sample 1 and ..............................................................…...79<br />
Table 13 The responses given to the small and large revised SA and<br />
UK pictures for both gender groups for the White<br />
pre-schoolers of sample 1 and 2............................................................…...80<br />
Table 14 Means and Standard deviations of correctly identified<br />
small and large pictures by the Black pre-schoolers<br />
of sample 1 and 2...........................................................................................81<br />
Table 15 Frequency and percentages of Black children<br />
with correct responses to the 20 small pictures.....................................…….82<br />
Table 16 The responses given to the small and large revised SA<br />
and UK pictures for each 2-month age interval for<br />
the Black pre-schoolers of sample 1 and 2..........................................…….83<br />
Table 17 The responses given to the small and large revised SA<br />
and UK pictures for each socio-economic group for<br />
the Black pre-schoolers of sample 1 and 2..............................................…...84<br />
Table 18 The responses given to the small and large revised SA<br />
and UK pictures for the two language groups for the<br />
Black pre-schoolers of sample 1 and 2....................................................…...85<br />
Table 19 The responses given to the small and large revised SA<br />
and UK pictures for both gender groups for the Black<br />
pre-schoolers of sample 1 and 2...............................................................…..86<br />
Table 20 Means and Standard deviations of correctly identified<br />
small and large SA and UK pictures by the Coloured pre-schoolers<br />
of sample 1 and 2...........................................................................................87<br />
Table 21 Frequency and percentages of Coloured children with correct<br />
responses to the 20 small pictures...........................................................…..88<br />
Table 22 The responses given to the small and large revised SA<br />
and UK pictures for each 2-month age interval for<br />
the Coloured pre-schoolers of sample 1 and 2.....................................……..89<br />
Table 23 The responses given to the small and large revised SA<br />
and UK pictures for each socio-economic group for the<br />
Coloured pre-schoolers of sample 1 and 2.............................................…....90<br />
vii