

Het volume van chirurgische ingrepen en de impact ervan op ... - KCE
Het volume van chirurgische ingrepen en de impact ervan op ... - KCE
Het volume van chirurgische ingrepen en de impact ervan op ... - KCE

Create successful ePaper yourself
Turn your PDF publications into a flip-book with our unique Google optimized e-Paper software.
<strong>KCE</strong> Reports 113 Volume Outcome 93<br />
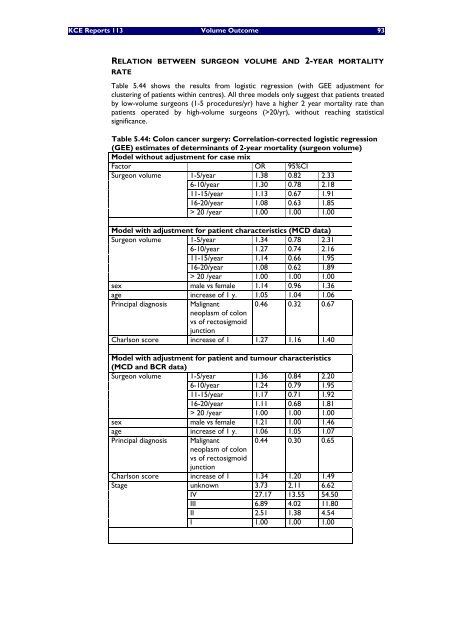
RELATION BETWEEN SURGEON VOLUME AND 2-YEAR MORTALITY<br />
RATE<br />
Table 5.44 shows the results from logistic regression (with GEE adjustm<strong>en</strong>t for<br />
clustering of pati<strong>en</strong>ts within c<strong>en</strong>tres). All three mo<strong>de</strong>ls only suggest that pati<strong>en</strong>ts treated<br />
by low-<strong>volume</strong> surgeons (1-5 procedures/yr) have a higher 2 year mortality rate than<br />
pati<strong>en</strong>ts <strong>op</strong>erated by high-<strong>volume</strong> surgeons (>20/yr), without reaching statistical<br />
significance.<br />
Table 5.44: Colon cancer surgery: Correlation-corrected logistic regression<br />
(GEE) estimates of <strong>de</strong>terminants of 2-year mortality (surgeon <strong>volume</strong>)<br />
Mo<strong>de</strong>l without adjustm<strong>en</strong>t for case mix<br />
Factor OR 95%CI<br />
Surgeon <strong>volume</strong> 1-5/year 1.38 0.82 2.33<br />
6-10/year 1.30 0.78 2.18<br />
11-15/year 1.13 0.67 1.91<br />
16-20/year 1.08 0.63 1.85<br />
> 20 /year 1.00 1.00 1.00<br />
Mo<strong>de</strong>l with adjustm<strong>en</strong>t for pati<strong>en</strong>t characteristics (MCD data)<br />
Surgeon <strong>volume</strong> 1-5/year 1.34 0.78 2.31<br />
6-10/year 1.27 0.74 2.16<br />
11-15/year 1.14 0.66 1.95<br />
16-20/year 1.08 0.62 1.89<br />
> 20 /year 1.00 1.00 1.00<br />
sex male vs female 1.14 0.96 1.36<br />
age increase of 1 y. 1.05 1.04 1.06<br />
Principal diagnosis Malignant<br />
ne<strong>op</strong>lasm of colon<br />
vs of rectosigmoid<br />
junction<br />
0.46 0.32 0.67<br />
Charlson score increase of 1 1.27 1.16 1.40<br />
Mo<strong>de</strong>l with adjustm<strong>en</strong>t for pati<strong>en</strong>t and tumour characteristics<br />
(MCD and BCR data)<br />
Surgeon <strong>volume</strong> 1-5/year 1.36 0.84 2.20<br />
6-10/year 1.24 0.79 1.95<br />
11-15/year 1.17 0.71 1.92<br />
16-20/year 1.11 0.68 1.81<br />
> 20 /year 1.00 1.00 1.00<br />
sex male vs female 1.21 1.00 1.46<br />
age increase of 1 y. 1.06 1.05 1.07<br />
Principal diagnosis Malignant<br />
ne<strong>op</strong>lasm of colon<br />
vs of rectosigmoid<br />
junction<br />
0.44 0.30 0.65<br />
Charlson score increase of 1 1.34 1.20 1.49<br />
Stage<br />
unknown 3.73 2.11 6.62<br />
IV 27.17 13.55 54.50<br />
III 6.89 4.02 11.80<br />
II 2.51 1.38 4.54<br />
I 1.00 1.00 1.00


