

Het volume van chirurgische ingrepen en de impact ervan op ... - KCE
Het volume van chirurgische ingrepen en de impact ervan op ... - KCE
Het volume van chirurgische ingrepen en de impact ervan op ... - KCE

You also want an ePaper? Increase the reach of your titles
YUMPU automatically turns print PDFs into web optimized ePapers that Google loves.
58 Volume Outcome <strong>KCE</strong> reports 113<br />
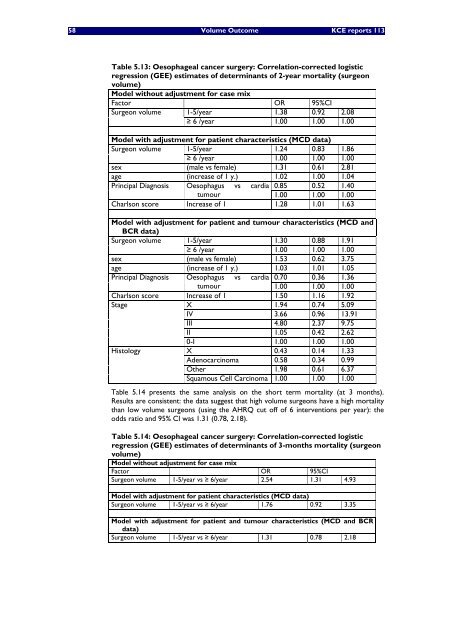
Table 5.13: Oes<strong>op</strong>hageal cancer surgery: Correlation-corrected logistic<br />
regression (GEE) estimates of <strong>de</strong>terminants of 2-year mortality (surgeon<br />
<strong>volume</strong>)<br />
Mo<strong>de</strong>l without adjustm<strong>en</strong>t for case mix<br />
Factor OR 95%CI<br />
Surgeon <strong>volume</strong> 1-5/year 1.38 0.92 2.08<br />
≥ 6 /year 1.00 1.00 1.00<br />
Mo<strong>de</strong>l with adjustm<strong>en</strong>t for pati<strong>en</strong>t characteristics (MCD data)<br />
Surgeon <strong>volume</strong> 1-5/year 1.24 0.83 1.86<br />
≥ 6 /year 1.00 1.00 1.00<br />
sex (male vs female) 1.31 0.61 2.81<br />
age (increase of 1 y.) 1.02 1.00 1.04<br />
Principal Diagnosis Oes<strong>op</strong>hagus vs cardia 0.85 0.52 1.40<br />
tumour 1.00 1.00 1.00<br />
Charlson score Increase of 1 1.28 1.01 1.63<br />
Mo<strong>de</strong>l with adjustm<strong>en</strong>t for pati<strong>en</strong>t and tumour characteristics (MCD and<br />
BCR data)<br />
Surgeon <strong>volume</strong> 1-5/year 1.30 0.88 1.91<br />
≥ 6 /year 1.00 1.00 1.00<br />
sex (male vs female) 1.53 0.62 3.75<br />
age (increase of 1 y.) 1.03 1.01 1.05<br />
Principal Diagnosis Oes<strong>op</strong>hagus vs cardia 0.70 0.36 1.36<br />
tumour 1.00 1.00 1.00<br />
Charlson score Increase of 1 1.50 1.16 1.92<br />
Stage<br />
X 1.94 0.74 5.09<br />
IV 3.66 0.96 13.91<br />
III 4.80 2.37 9.75<br />
II 1.05 0.42 2.62<br />
0-I 1.00 1.00 1.00<br />
Histology<br />
X 0.43 0.14 1.33<br />
Ad<strong>en</strong>ocarcinoma 0.58 0.34 0.99<br />
Other 1.98 0.61 6.37<br />
Squamous Cell Carcinoma 1.00 1.00 1.00<br />
Table 5.14 pres<strong>en</strong>ts the same analysis on the short term mortality (at 3 months).<br />
Results are consist<strong>en</strong>t: the data suggest that high <strong>volume</strong> surgeons have a high mortality<br />
than low <strong>volume</strong> surgeons (using the AHRQ cut off of 6 interv<strong>en</strong>tions per year): the<br />
odds ratio and 95% CI was 1.31 (0.78, 2.18).<br />
Table 5.14: Oes<strong>op</strong>hageal cancer surgery: Correlation-corrected logistic<br />
regression (GEE) estimates of <strong>de</strong>terminants of 3-months mortality (surgeon<br />
<strong>volume</strong>)<br />
Mo<strong>de</strong>l without adjustm<strong>en</strong>t for case mix<br />
Factor OR 95%CI<br />
Surgeon <strong>volume</strong> 1-5/year vs ≥ 6/year 2.54 1.31 4.93<br />
Mo<strong>de</strong>l with adjustm<strong>en</strong>t for pati<strong>en</strong>t characteristics (MCD data)<br />
Surgeon <strong>volume</strong> 1-5/year vs ≥ 6/year 1.76 0.92 3.35<br />
Mo<strong>de</strong>l with adjustm<strong>en</strong>t for pati<strong>en</strong>t and tumour characteristics (MCD and BCR<br />
data)<br />
Surgeon <strong>volume</strong> 1-5/year vs ≥ 6/year 1.31 0.78 2.18


