J-Link / J-Trace User Guide (UM08001) - Microcontrollers
J-Link / J-Trace User Guide (UM08001) - Microcontrollers
J-Link / J-Trace User Guide (UM08001) - Microcontrollers

Create successful ePaper yourself
Turn your PDF publications into a flip-book with our unique Google optimized e-Paper software.
If you experience problems with a particular device, do not hesitate to contact Segger.<br />
7.5.1 LPC<br />
7.5.1.1 Fast GPIO bug<br />
The values of the fast GPIO registers can not be read direct via JTAG from a debugger.<br />
The direct access to the registers corrupts the returned values. This means that<br />
the values in the fast GPIO registers normally can not be checked or changed from a<br />
debugger.<br />
Solution / Workaround<br />
J-<strong>Link</strong> supports command strings which can be used to read a memory area indirect.<br />
Indirectly reading means that a small code snippet will be written into RAM of the<br />
target device, which reads and transfers the data of the specified memory area to the<br />
debugger. Indirectly reading solves the fast GPIO problem, because only direct register<br />
access corrupts the register contents.<br />
Define a 256 byte aligned area in RAM of the LPC target device with the J-<strong>Link</strong> command<br />
map ram and define afterwards the memory area which should be read indirect<br />
with the command map indirectread to use the indirectly reading feature of J-<strong>Link</strong>.<br />
Note that the data in the defined RAM area is saved and will be restored after using<br />
the RAM area.<br />
This information is applicable to the following devices:<br />
• LPC2101<br />
• LPC2102<br />
• LPC2103<br />
• LPC213x/01<br />
• LPC214x (all devices)<br />
• LPC23xx (all devices)<br />
• LPC24xx (all devices)<br />
Example<br />
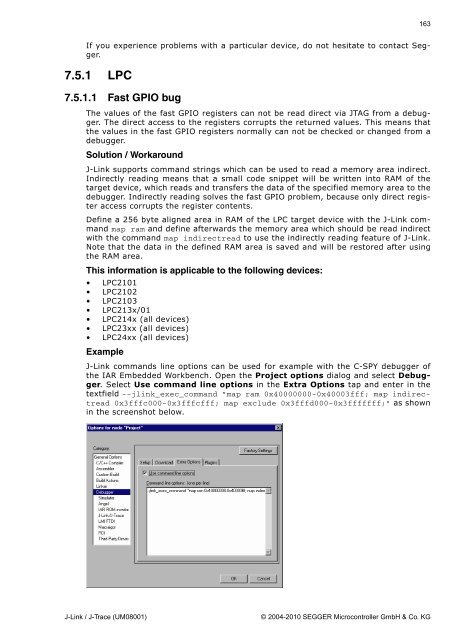
J-<strong>Link</strong> commands line options can be used for example with the C-SPY debugger of<br />
the IAR Embedded Workbench. Open the Project options dialog and select Debugger.<br />
Select Use command line options in the Extra Options tap and enter in the<br />
textfield --jlink_exec_command "map ram 0x40000000-0x40003fff; map indirectread<br />
0x3fffc000-0x3fffcfff; map exclude 0x3fffd000-0x3fffffff;" as shown<br />
in the screenshot below.<br />
J-<strong>Link</strong> / J-<strong>Trace</strong> (<strong>UM08001</strong>) © 2004-2010 SEGGER Microcontroller GmbH & Co. KG<br />
163