- Page 1 and 2: MANUAL FOR SOCIAL IMPACT ASSESSMENT
- Page 3 and 4: Table of Contents T1 Introduction t
- Page 5 and 6: List of Boxes Box T1. General Data
- Page 7 and 8: Forest Trends’ mission is to main
- Page 9 and 10: List of Acronyms (Core Guidance and
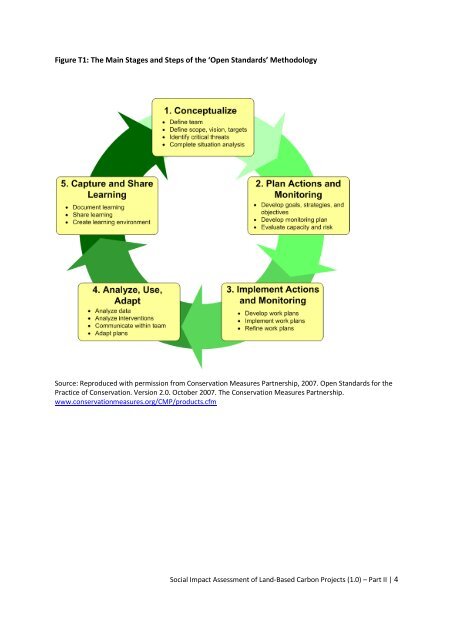
- Page 11: Sections T5 and T6 present a range
- Page 15 and 16: Figure T2: Example of a Conceptual
- Page 17 and 18: Figure T4: Generic Conceptual Model
- Page 19 and 20: Stages 3-5 of Open Standards The re
- Page 21 and 22: Figure T7: Diagram of the ROtI Anal
- Page 23 and 24: table so they can be read, discusse
- Page 25 and 26: Table T1: Theory of Change for Seyc
- Page 27 and 28: T2.4 Participatory Impact Pathways
- Page 29 and 30: Table T4: The PIPA Outcomes Logic M
- Page 31 and 32: Main Sources and Further Guidance h
- Page 33 and 34: T3 Sustainability Framework Approac
- Page 35 and 36: Figure T12: SAPA Initiative Modifie
- Page 37 and 38: 1. Identify a small group of key in
- Page 39 and 40: Table T6: Example of LOAM Livelihoo
- Page 41 and 42: T4 Matching Methods T4.1 Introducti
- Page 43 and 44: Advantages and Disadvantages of ‘
- Page 45 and 46: Box T1. General Data Collection and
- Page 47 and 48: Box T3. Data Collection Methods Pro
- Page 49 and 50: T6 Specific Data Collection Methods
- Page 51 and 52: Table T8: Example of a Household BN
- Page 53 and 54: The poverty index can range from 0%
- Page 55 and 56: The PIA guide proposes the followin
- Page 57 and 58: day. The ‘before project’ score
- Page 59 and 60: Figure T15: “Before and After”
- Page 61 and 62: Table T10: Pair-Wise Ranking Showin
- Page 63 and 64:
Impact calendars Impact calendars c
- Page 65 and 66:
A large sample is needed to be conf
- Page 67 and 68:
Table T15: Scoring of Changes in Ag
- Page 69 and 70:
Table T17: QPA Scoring of Social Eq
- Page 71 and 72:
T6.4 Participatory Economic Valuati
- Page 73 and 74:
Advantages and Disadvantages of Par
- Page 75 and 76:
The stories are collected from thos
- Page 77 and 78:
Main Sources and Further Guidance D
- Page 79 and 80:
Table T19: Stakeholder Analysis Pro
- Page 81 and 82:
Figure T18. Venn Diagram with Stake
- Page 83 and 84:
T7.2 Problem Trees Assuming it is p
- Page 85 and 86:
T7.3 Scenario Analysis Scenarios ar
- Page 87 and 88:
Box T7. Driving Forces in a Communi
- Page 89 and 90:
Maack, J.N. 2001. Scenario analysis
- Page 91 and 92:
In terms of non-monetary benefits,
- Page 93 and 94:
and duration of employment, the sta
- Page 95 and 96:
Physical Capital Positive changes i
- Page 97 and 98:
these strategic resource off-limits
- Page 99 and 100:
einforce existing institutions or n
- Page 101 and 102:
PROJECT: PROFAFOR TYPE: Plantations
- Page 103 and 104:
their occurrence will depend in lar
- Page 105 and 106:
HUMAN CAPITAL Increase in perceptio
- Page 107 and 108:
Table T26: Potential Mid- to Long-T
- Page 109 and 110:
Figure T20: Example of Relationship
- Page 111 and 112:
Figure T22: Additional Potential So
- Page 113 and 114:
T9 Further Guidance on Indicator Se
- Page 115 and 116:
Box T9. Goals and Indicators Defini
- Page 117 and 118:
When selecting indicators, it is be
- Page 119 and 120:
Table T27: Indicator Quality Assess
- Page 121 and 122:
Box T10. Indicators Derived from th
- Page 123 and 124:
T9.5 Disaggregating Indicators Mult
- Page 125 and 126:
Mayoux, L. 2001. What Do We Want to
- Page 127 and 128:
Landscape Outcomes Assessment Metho
- Page 129 and 130:
• Access to essential services (w
- Page 131 and 132:
T10.3 Social Indicators Derived fro
- Page 133 and 134:
Empowerment of women indicators:
- Page 135 and 136:
CCBA, 2008. Climate, Community & Bi
- Page 137 and 138:
James A., Pangtey V., Singh P. & Vi
- Page 139:
SEEP Network. 2006. Social Performa