manual for social impact assessment of land-based ... - Forest Trends
manual for social impact assessment of land-based ... - Forest Trends
manual for social impact assessment of land-based ... - Forest Trends

You also want an ePaper? Increase the reach of your titles
YUMPU automatically turns print PDFs into web optimized ePapers that Google loves.
Impact calendars<br />
Impact calendars can be useful <strong>for</strong> measuring <strong>impact</strong>s against ‘dimensional’ indicators such as time<br />
and distance. Catley et al (2008) describe how an <strong>impact</strong> calendar was used to analyze the number<br />
<strong>of</strong> months <strong>of</strong> household food security ‘be<strong>for</strong>e’ and ‘after’ a project. Project participants were given<br />
25 counters representing a household’s post-harvest food balance. Using 12 cards, one <strong>for</strong> each<br />
month <strong>of</strong> the year, participants were asked to distribute the counters along a 12 month calendar to<br />
show the monthly household utilization <strong>of</strong> the harvested maize, as shown in Table T12.<br />
Table T12: Food Security Impact Calendar Using 25 Counters<br />
April May June July Aug Sept Oct Nov Dec Jan Feb Mar<br />
2004-2005 •••••• ••••• •••• •• •<br />
•••••• •<br />
2006-2007 •••••• •••• •••• ••• ••• ••<br />
actual •••<br />
2006-2007 •••••• ••••• ••••<br />
(Control) ••••••<br />
••<br />
••<br />
Source: Reproduced with permission from Catley, A., Burns, J., Abebe, D. and Suji, O. (2008). Participatory<br />
Impact Assessment: A guide <strong>for</strong> practitioners. Feinstein International Center, Med<strong>for</strong>d<br />
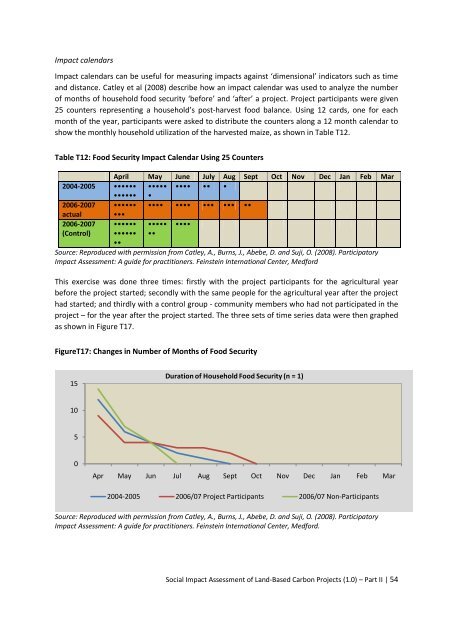
This exercise was done three times: firstly with the project participants <strong>for</strong> the agricultural year<br />
be<strong>for</strong>e the project started; secondly with the same people <strong>for</strong> the agricultural year after the project<br />
had started; and thirdly with a control group - community members who had not participated in the<br />
project – <strong>for</strong> the year after the project started. The three sets <strong>of</strong> time series data were then graphed<br />
as shown in Figure T17.<br />
FigureT17: Changes in Number <strong>of</strong> Months <strong>of</strong> Food Security<br />
15<br />
10<br />
5<br />
0<br />
Duration <strong>of</strong> Household Food Security (n = 1)<br />
Apr May Jun Jul Aug Sept Oct Nov Dec Jan Feb Mar<br />
2004-2005 2006/07 Project Participants 2006/07 Non-Participants<br />
Source: Reproduced with permission from Catley, A., Burns, J., Abebe, D. and Suji, O. (2008). Participatory<br />
Impact Assessment: A guide <strong>for</strong> practitioners. Feinstein International Center, Med<strong>for</strong>d.<br />
Social Impact Assessment <strong>of</strong> Land-Based Carbon Projects (1.0) – Part II | 54