Report 2010 - Italcementi Group
Report 2010 - Italcementi Group
Report 2010 - Italcementi Group

You also want an ePaper? Increase the reach of your titles
YUMPU automatically turns print PDFs into web optimized ePapers that Google loves.
<strong>2010</strong> Annual <strong>Report</strong><br />
Presentazione 6<br />
Consolidated Annual <strong>Report</strong> Directors’ report 27<br />
Corporate Governance Consolidated financial statements Financial statements 68<br />
<strong>Italcementi</strong> S.p.A. financial statements Notes 73<br />
Annexes 142<br />
<strong>Report</strong> of the Independent Auditors 151<br />
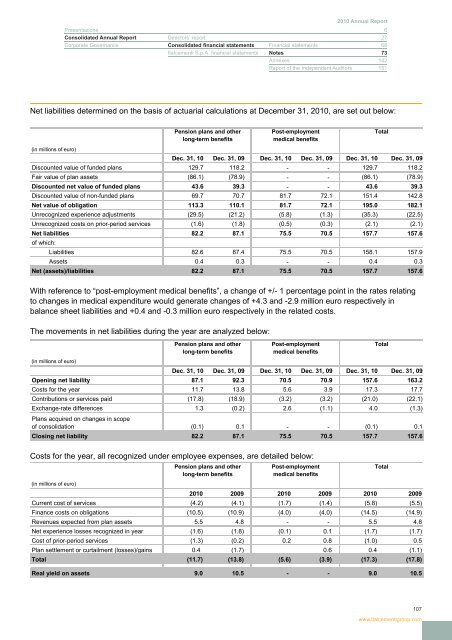
Net liabilities determined on the basis of actuarial calculations at December 31, <strong>2010</strong>, are set out below:<br />
Pension plans and other<br />
long-term benefits<br />
Post-employment<br />
medical benefits<br />
(in millions of euro)<br />
Dec. 31, 10 Dec. 31, 09 Dec. 31, 10 Dec. 31, 09 Dec. 31, 10 Dec. 31, 09<br />
Discounted value of funded plans 129.7 118.2 - - 129.7 118.2<br />
Fair value of plan assets (86.1) (78.9) - - (86.1) (78.9)<br />
Discounted net value of funded plans 43.6 39.3 - - 43.6 39.3<br />
Discounted value of non-funded plans 69.7 70.7 81.7 72.1 151.4 142.8<br />
Net value of obligation 113.3 110.1 81.7 72.1 195.0 182.1<br />
Unrecognized experience adjustments (29.5) (21.2) (5.8) (1.3) (35.3) (22.5)<br />
Unrecognized costs on prior-period services (1.6) (1.8) (0.5) (0.3) (2.1) (2.1)<br />
Net liabilities 82.2 87.1 75.5 70.5 157.7 157.6<br />
of which:<br />
Liabilities 82.6 87.4 75.5 70.5 158.1 157.9<br />
Assets 0.4 0.3 - - 0.4 0.3<br />
Net (assets)/liabilities 82.2 87.1 75.5 70.5 157.7 157.6<br />
Total<br />
With reference to “post-employment medical benefits”, a change of +/- 1 percentage point in the rates relating<br />
to changes in medical expenditure would generate changes of +4.3 and -2.9 million euro respectively in<br />
balance sheet liabilities and +0.4 and -0.3 million euro respectively in the related costs.<br />
The movements in net liabilities during the year are analyzed below:<br />
Pension plans and other<br />
long-term benefits<br />
Post-employment<br />
medical benefits<br />
(in millions of euro)<br />
Dec. 31, 10 Dec. 31, 09 Dec. 31, 10 Dec. 31, 09 Dec. 31, 10 Dec. 31, 09<br />
Opening net liability 87.1 92.3 70.5 70.9 157.6 163.2<br />
Costs for the year 11.7 13.8 5.6 3.9 17.3 17.7<br />
Contributions or services paid (17.8) (18.9) (3.2) (3.2) (21.0) (22.1)<br />
Exchange-rate differences 1.3 (0.2) 2.6 (1.1) 4.0 (1.3)<br />
Plans acquired on changes in scope<br />
of consolidation (0.1) 0.1 - - (0.1) 0.1<br />
Closing net liability 82.2 87.1 75.5 70.5 157.7 157.6<br />
Total<br />
Costs for the year, all recognized under employee expenses, are detailed below:<br />
Pension plans and other<br />
long-term benefits<br />
Post-employment<br />
medical benefits<br />
(in millions of euro)<br />
<strong>2010</strong> 2009 <strong>2010</strong> 2009 <strong>2010</strong> 2009<br />
Current cost of services (4.2) (4.1) (1.7) (1.4) (5.8) (5.5)<br />
Finance costs on obligations (10.5) (10.9) (4.0) (4.0) (14.5) (14.9)<br />
Revenues expected from plan assets 5.5 4.8 - - 5.5 4.8<br />
Net experience losses recognized in year (1.6) (1.8) (0.1) 0.1 (1.7) (1.7)<br />
Cost of prior-period services (1.3) (0.2) 0.2 0.8 (1.0) 0.5<br />
Plan settlement or curtailment (losses)/gains 0.4 (1.7) 0.6 0.4 (1.1)<br />
Total (11.7) (13.8) (5.6) (3.9) (17.3) (17.8)<br />
Real yield on assets 9.0 10.5 - - 9.0 10.5<br />
Total<br />
107<br />
www.italcementigroup.com