Report 2010 - Italcementi Group
Report 2010 - Italcementi Group
Report 2010 - Italcementi Group

Create successful ePaper yourself
Turn your PDF publications into a flip-book with our unique Google optimized e-Paper software.
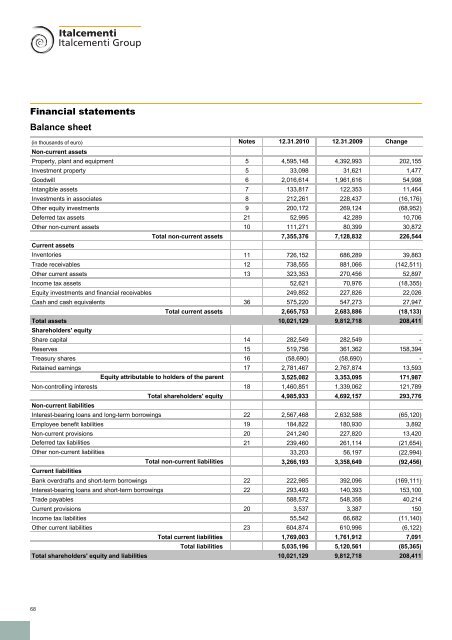
Financial statements<br />
Balance sheet<br />
(in thousands of euro) Notes 12.31.<strong>2010</strong> 12.31.2009 Change<br />
Non-current assets<br />
Property, plant and equipment 5 4,595,148 4,392,993 202,155<br />
Investment property 5 33,098 31,621 1,477<br />
Goodwill 6 2,016,614 1,961,616 54,998<br />
Intangible assets 7 133,817 122,353 11,464<br />
Investments in associates 8 212,261 228,437 (16,176)<br />
Other equity investments 9 200,172 269,124 (68,952)<br />
Deferred tax assets 21 52,995 42,289 10,706<br />
Other non-current assets 10 111,271 80,399 30,872<br />
Total non-current assets 7,355,376 7,128,832 226,544<br />
Current assets<br />
Inventories 11 726,152 686,289 39,863<br />
Trade receivables 12 738,555 881,066 (142,511)<br />
Other current assets 13 323,353 270,456 52,897<br />
Income tax assets 52,621 70,976 (18,355)<br />
Equity investments and financial receivables 249,852 227,826 22,026<br />
Cash and cash equivalents 36 575,220 547,273 27,947<br />
Total current assets 2,665,753 2,683,886 (18,133)<br />
Total assets 10,021,129 9,812,718 208,411<br />
Shareholders' equity<br />
Share capital 14 282,549 282,549 -<br />
Reserves 15 519,756 361,362 158,394<br />
Treasury shares 16 (58,690) (58,690) -<br />
Retained earnings 17 2,781,467 2,767,874 13,593<br />
Equity attributable to holders of the parent 3,525,082 3,353,095 171,987<br />
Non-controlling interests 18 1,460,851 1,339,062 121,789<br />
Total shareholders' equity 4,985,933 4,692,157 293,776<br />
Non-current liabilities<br />
Interest-bearing loans and long-term borrowings 22 2,567,468 2,632,588 (65,120)<br />
Employee benefit liabilities 19 184,822 180,930 3,892<br />
Non-current provisions 20 241,240 227,820 13,420<br />
Deferred tax liabilities 21 239,460 261,114 (21,654)<br />
Other non-current liabilities 33,203 56,197 (22,994)<br />
Total non-current liabilities 3,266,193 3,358,649 (92,456)<br />
Current liabilities<br />
Bank overdrafts and short-term borrowings 22 222,985 392,096 (169,111)<br />
Interest-bearing loans and short-term borrowings 22 293,493 140,393 153,100<br />
Trade payables 588,572 548,358 40,214<br />
Current provisions 20 3,537 3,387 150<br />
Income tax liabilities 55,542 66,682 (11,140)<br />
Other current liabilities 23 604,874 610,996 (6,122)<br />
Total current liabilities 1,769,003 1,761,912 7,091<br />
Total liabilities 5,035,196 5,120,561 (85,365)<br />
Total shareholders' equity and liabilities 10,021,129 9,812,718 208,411<br />
68