Financial statements Balance sheet (in thousands of euro) Notes 12.31.<strong>2010</strong> 12.31.2009 Change Non-current assets Property, plant and equipment 5 4,595,148 4,392,993 202,155 Investment property 5 33,098 31,621 1,477 Goodwill 6 2,016,614 1,961,616 54,998 Intangible assets 7 133,817 122,353 11,464 Investments in associates 8 212,261 228,437 (16,176) Other equity investments 9 200,172 269,124 (68,952) Deferred tax assets 21 52,995 42,289 10,706 Other non-current assets 10 111,271 80,399 30,872 Total non-current assets 7,355,376 7,128,832 226,544 Current assets Inventories 11 726,152 686,289 39,863 Trade receivables 12 738,555 881,066 (142,511) Other current assets 13 323,353 270,456 52,897 Income tax assets 52,621 70,976 (18,355) Equity investments and financial receivables 249,852 227,826 22,026 Cash and cash equivalents 36 575,220 547,273 27,947 Total current assets 2,665,753 2,683,886 (18,133) Total assets 10,021,129 9,812,718 208,411 Shareholders' equity Share capital 14 282,549 282,549 - Reserves 15 519,756 361,362 158,394 Treasury shares 16 (58,690) (58,690) - Retained earnings 17 2,781,467 2,767,874 13,593 Equity attributable to holders of the parent 3,525,082 3,353,095 171,987 Non-controlling interests 18 1,460,851 1,339,062 121,789 Total shareholders' equity 4,985,933 4,692,157 293,776 Non-current liabilities Interest-bearing loans and long-term borrowings 22 2,567,468 2,632,588 (65,120) Employee benefit liabilities 19 184,822 180,930 3,892 Non-current provisions 20 241,240 227,820 13,420 Deferred tax liabilities 21 239,460 261,114 (21,654) Other non-current liabilities 33,203 56,197 (22,994) Total non-current liabilities 3,266,193 3,358,649 (92,456) Current liabilities Bank overdrafts and short-term borrowings 22 222,985 392,096 (169,111) Interest-bearing loans and short-term borrowings 22 293,493 140,393 153,100 Trade payables 588,572 548,358 40,214 Current provisions 20 3,537 3,387 150 Income tax liabilities 55,542 66,682 (11,140) Other current liabilities 23 604,874 610,996 (6,122) Total current liabilities 1,769,003 1,761,912 7,091 Total liabilities 5,035,196 5,120,561 (85,365) Total shareholders' equity and liabilities 10,021,129 9,812,718 208,411 68
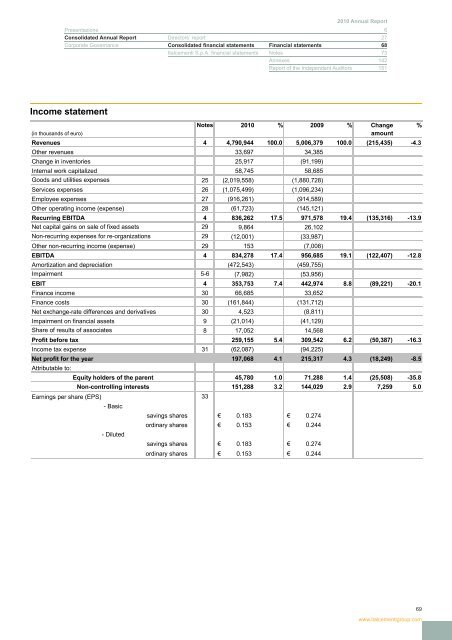
<strong>2010</strong> Annual <strong>Report</strong> Presentazione 6 Consolidated Annual <strong>Report</strong> Directors’ report 27 Corporate Governance Consolidated financial statements Financial statements 68 <strong>Italcementi</strong> S.p.A. financial statements Notes 73 Annexes 142 <strong>Report</strong> of the Independent Auditors 151 Income statement Notes <strong>2010</strong> % 2009 % Change % (in thousands of euro) amount Revenues 4 4,790,944 100.0 5,006,379 100.0 (215,435) -4.3 Other revenues 33,697 34,385 Change in inventories 25,917 (91,199) Internal work capitalized 58,745 58,685 Goods and utilities expenses 25 (2,019,558) (1,880,728) Services expenses 26 (1,075,499) (1,096,234) Employee expenses 27 (916,261) (914,589) Other operating income (expense) 28 (61,723) (145,121) Recurring EBITDA 4 836,262 17.5 971,578 19.4 (135,316) -13.9 Net capital gains on sale of fixed assets 29 9,864 26,102 Non-recurring expenses for re-organizations 29 (12,001) (33,987) Other non-recurring income (expense) 29 153 (7,008) EBITDA 4 834,278 17.4 956,685 19.1 (122,407) -12.8 Amortization and depreciation (472,543) (459,755) Impairment 5-6 (7,982) (53,956) EBIT 4 353,753 7.4 442,974 8.8 (89,221) -20.1 Finance income 30 66,685 33,652 Finance costs 30 (161,844) (131,712) Net exchange-rate differences and derivatives 30 4,523 (8,811) Impairment on financial assets 9 (21,014) (41,129) Share of results of associates 8 17,052 14,568 Profit before tax 259,155 5.4 309,542 6.2 (50,387) -16.3 Income tax expense 31 (62,087) (94,225) Net profit for the year 197,068 4.1 215,317 4.3 (18,249) -8.5 Attributable to: Equity holders of the parent 45,780 1.0 71,288 1.4 (25,508) -35.8 Non-controlling interests 151,288 3.2 144,029 2.9 7,259 5.0 Earnings per share (EPS) 33 - Basic savings shares € 0.183 € 0.274 ordinary shares € 0.153 € 0.244 - Diluted savings shares € 0.183 € 0.274 ordinary shares € 0.153 € 0.244 69 www.italcementigroup.com
- Page 1 and 2:
2010 Annual Report
- Page 3 and 4:
2010 Annual Report Italcementi S.p.
- Page 5 and 6:
In the past three financial years w
- Page 7 and 8:
2010 Annual Report Presentation Gen
- Page 9 and 10:
2010 Annual Report Presentation Gen
- Page 11 and 12:
2010 Annual Report Presentation Gen
- Page 13 and 14:
2010 Annual Report Presentation Gen
- Page 15 and 16:
2010 Annual Report Presentation Gen
- Page 17 and 18: 2010 Annual Report Presentation Gen
- Page 19 and 20: 2010 Annual Report Presentation Gen
- Page 21 and 22: 2010 Annual Report Presentation Gen
- Page 23 and 24: 2010 Annual Report Presentation Gen
- Page 25: 2010 Annual Report Presentation Gen
- Page 28 and 29: Directors’ report Following the a
- Page 30 and 31: Significant events for the year Sig
- Page 32 and 33: Business and financial performance
- Page 34 and 35: Fourth-quarter sales volumes and in
- Page 36 and 37: Revenues and operating results Cont
- Page 38 and 39: Total comprehensive income In 2010,
- Page 40 and 41: Net debt breakdown (in millions of
- Page 42 and 43: 2010 to the Internal Control Commit
- Page 44 and 45: Conformity risks The Group is subje
- Page 46 and 47: constraints imposed by the stringen
- Page 48 and 49: The construction sector reported a
- Page 50 and 51: ASIA Thailand India Others (1) Tota
- Page 52 and 53: The reduction arose essentially as
- Page 54 and 55: Turkey Work continued in 2010 to ob
- Page 56 and 57: variable amount. The fixed amount i
- Page 58 and 59: Information systems The three-year
- Page 60 and 61: Raw materials and alternative fuels
- Page 62 and 63: Engineering, technical assistance,
- Page 64 and 65: serves public companies and institu
- Page 66 and 67: Set Group Holding represents a sign
- Page 70 and 71: Statement of comprehensive income (
- Page 72 and 73: Consolidated cash flow statement No
- Page 74 and 75: 21. Deferred tax 22. Net debt 23. O
- Page 76 and 77: no longer generate goodwill, nor ga
- Page 78 and 79: Subsidiaries Subsidiaries are compa
- Page 80 and 81: 1.5. Translation of foreign currenc
- Page 82 and 83: 1.10. Intangible assets Intangible
- Page 84 and 85: deferred tax assets are reviewed at
- Page 86 and 87: Pending publication of a standard/i
- Page 88 and 89: 2. Exchange rates used to translate
- Page 90 and 91: 4. Operating segment disclosure The
- Page 92 and 93: Operating segments The table below
- Page 94 and 95: The table below sets out other segm
- Page 96 and 97: Assets 5 Property, plant and equipm
- Page 98 and 99: 6.2 Goodwill testing Goodwill acqui
- Page 100 and 101: “Concessions” are amortized ove
- Page 102 and 103: 9. Other equity investments This no
- Page 104 and 105: 12. Trade receivables (in thousands
- Page 106 and 107: 17. Dividends paid Dividends declar
- Page 108 and 109: The movements in defined benefit li
- Page 110 and 111: 20. Provisions Non-current and curr
- Page 112 and 113: 22.1 Loans and borrowings Loans and
- Page 114 and 115: ) in the third quarter of 2010, Ita
- Page 116 and 117: v) in the third quarter of 2010, Ci
- Page 118 and 119:
Fair value - hierarchy In determini
- Page 120 and 121:
In 2009 and 2010, in view of the su
- Page 122 and 123:
22.4 Interest-rate risk Notional va
- Page 124 and 125:
22.6 Exposure to exchange-rate risk
- Page 126 and 127:
22.8 Hedge Accounting The effects a
- Page 128 and 129:
At December 31, 2010, the average m
- Page 130 and 131:
25. Goods and utilities expenses Go
- Page 132 and 133:
The following table sets out the de
- Page 134 and 135:
The reconciliation between the theo
- Page 136 and 137:
34. Transactions with related parti
- Page 138 and 139:
36. Cash flow statement 36.1. Cash
- Page 140 and 141:
38. Considerations to the Independe
- Page 142 and 143:
Annex 1 The following table has bee
- Page 144 and 145:
Company Registered office Share cap
- Page 146 and 147:
Company Registered office Share cap
- Page 148 and 149:
Company Registered office Share cap
- Page 150:
Representation form pursuant to art
- Page 154 and 155:
Financial statements Balance sheet
- Page 156 and 157:
Statement of comprehensive income (
- Page 158 and 159:
Cash flow statement 2010 2009 (euro
- Page 160 and 161:
Transactions with related parties o
- Page 164 and 165:
Summary of resolutions The Annual G
- Page 166 and 167:
Extraordinary session: 1) to amend
- Page 168 and 169:
Report on Corporate Governance and
- Page 170 and 171:
c) Significant shareholders as disc
- Page 172 and 173:
In the event of presentation of mor
- Page 174 and 175:
By resolution of June 20 th , 2007,
- Page 176 and 177:
d) Analysis of controls at process
- Page 178 and 179:
8) the various company functions, w
- Page 180 and 181:
knowledge of the company and its dy
- Page 182 and 183:
Emilio Zanetti * Unione di Banche I
- Page 184 and 185:
at their request, the Chief Executi
- Page 186 and 187:
The lists must be presented at the
- Page 188 and 189:
- for the simultaneous replacement
- Page 190 and 191:
Within the Board of Directors, the
- Page 192 and 193:
their level of agreement has been m
- Page 194 and 195:
The Board of Directors, with the as
- Page 196 and 197:
TABLE 2 BOARD OF STATUTORY AUDITORS
- Page 198 and 199:
Code of ethics The Code, approved f
- Page 200 and 201:
only if the unrelated shareholders
- Page 202 and 203:
EQUITY INVESTMENTS OF DIRECTORS, ST
- Page 204 and 205:
parent company, on a regular basis,
- Page 206 and 207:
Stock option plan for directors - 2
- Page 208 and 209:
Based on the opinion of the Committ
- Page 210 and 211:
g) Share capital increase; disposal
- Page 212 and 213:
Italcementi S.p.A. will have a pre-
- Page 214 and 215:
iii) approving for each assignee th
- Page 216 and 217:
216
- Page 218 and 219:
Annex 1 Highlights from the most re
- Page 220 and 221:
(in thousands of euro) Full name Po
- Page 222 and 223:
STOCK OPTIONS GRANTED TO DIRECTORS
- Page 224 and 225:
CIMENTS FRANÇAIS S.A. Options held
- Page 226 and 227:
Corporate bodies resulting from the
- Page 228:
italcementi S.p.A. Via G. Camozzi,