Report 2010 - Italcementi Group
Report 2010 - Italcementi Group
Report 2010 - Italcementi Group

Create successful ePaper yourself
Turn your PDF publications into a flip-book with our unique Google optimized e-Paper software.
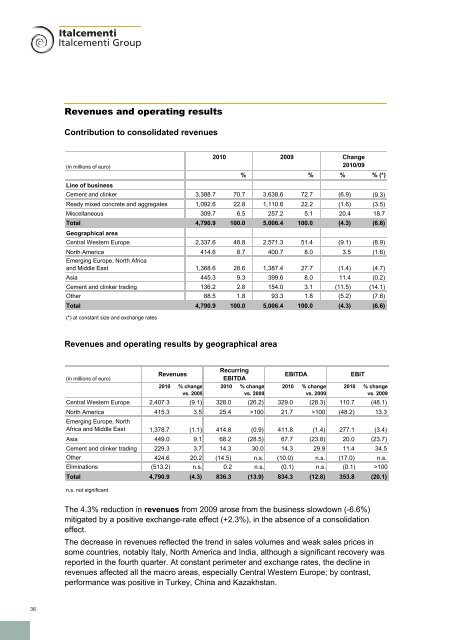
Revenues and operating results<br />
Contribution to consolidated revenues<br />
(in millions of euro)<br />
% % % % (*)<br />
Line of business<br />
Cement and clinker 3,388.7 70.7 3,638.6 72.7 (6.9) (9.3)<br />
Ready mixed concrete and aggregates 1,092.6 22.8 1,110.6 22.2 (1.6) (3.5)<br />
Miscellaneous 309.7 6.5 257.2 5.1 20.4 18.7<br />
Total 4,790.9 100.0 5,006.4 100.0 (4.3) (6.6)<br />
Geographical area<br />
Central Western Europe 2,337.6 48.8 2,571.3 51.4 (9.1) (8.9)<br />
North America 414.6 8.7 400.7 8.0 3.5 (1.6)<br />
Emerging Europe, North Africa<br />
and Middle East 1,368.6 28.6 1,387.4 27.7 (1.4) (4.7)<br />
Asia 445.3 9.3 399.6 8.0 11.4 (0.2)<br />
Cement and clinker trading 136.2 2.8 154.0 3.1 (11.5) (14.1)<br />
Other 88.5 1.8 93.3 1.8 (5.2) (7.8)<br />
Total 4,790.9 100.0 5,006.4 100.0 (4.3) (6.6)<br />
(*) at constant size and exchange rates<br />
<strong>2010</strong> 2009 Change<br />
<strong>2010</strong>/09<br />
Revenues and operating results by geographical area<br />
(in millions of euro)<br />
<strong>2010</strong> % change<br />
vs. 2009<br />
Recurring<br />
EBITDA<br />
<strong>2010</strong> % change<br />
vs. 2009<br />
<strong>2010</strong> % change<br />
vs. 2009<br />
<strong>2010</strong> % change<br />
vs. 2009<br />
Central Western Europe 2,407.3 (9.1) 328.0 (26.2) 329.0 (28.3) 110.7 (48.1)<br />
North America 415.3 3.5 25.4 >100 21.7 >100 (48.2) 13.3<br />
Emerging Europe, North<br />
Africa and Middle East 1,378.7 (1.1) 414.8 (0.9) 411.8 (1.4) 277.1 (3.4)<br />
Asia 449.0 9.1 68.2 (28.5) 67.7 (23.8) 20.0 (23.7)<br />
Cement and clinker trading 229.3 3.7 14.3 30.0 14.3 29.9 11.4 34.5<br />
Other 424.6 20.2 (14.5) n.s. (10.0) n.s. (17.0) n.s.<br />
Eliminations (513.2) n.s. 0.2 n.s. (0.1) n.s. (0.1) >100<br />
Total 4,790.9 (4.3) 836.3 (13.9) 834.3 (12.8) 353.8 (20.1)<br />
n.s. not significant<br />
Revenues<br />
EBITDA<br />
EBIT<br />
The 4.3% reduction in revenues from 2009 arose from the business slowdown (-6.6%)<br />
mitigated by a positive exchange-rate effect (+2.3%), in the absence of a consolidation<br />
effect.<br />
The decrease in revenues reflected the trend in sales volumes and weak sales prices in<br />
some countries, notably Italy, North America and India, although a significant recovery was<br />
reported in the fourth quarter. At constant perimeter and exchange rates, the decline in<br />
revenues affected all the macro areas, especially Central Western Europe; by contrast,<br />
performance was positive in Turkey, China and Kazakhstan.<br />
36