Report 2010 - Italcementi Group
Report 2010 - Italcementi Group
Report 2010 - Italcementi Group

Create successful ePaper yourself
Turn your PDF publications into a flip-book with our unique Google optimized e-Paper software.
<strong>2010</strong> Annual <strong>Report</strong><br />
Presentazione 6<br />
Consolidated Annual <strong>Report</strong> Directors’ report 27<br />
Corporate Governance Consolidated financial statements Financial statements 68<br />
<strong>Italcementi</strong> S.p.A. financial statements Notes 73<br />
Annexes 142<br />
<strong>Report</strong> of the Independent Auditors 151<br />
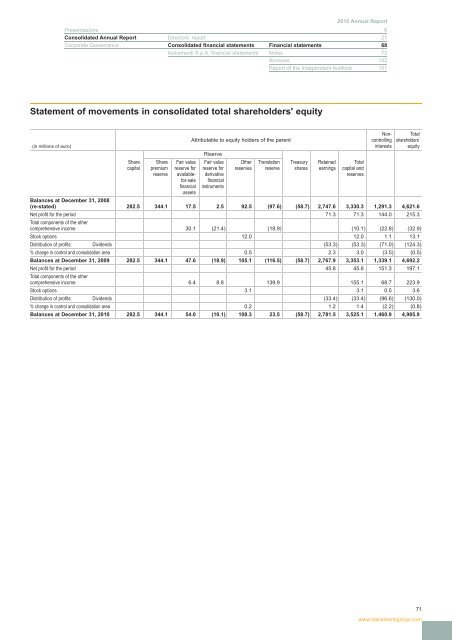
Statement of movements in consolidated total shareholders' equity<br />
Non- Total<br />
Attributable to equity holders of the parent controlling shareholders’<br />
(in millions of euro) interests equity<br />
Riserve<br />
Share Share Fair value Fair value Other Translation Treasury Retained Total<br />
capital premium reserve for reserve for reserves reserve shares earnings capital and<br />
reserve available- derivative reserves<br />
for-sale financial<br />
financial instruments<br />
assets<br />
Balances at December 31, 2008<br />
(re-stated) 282.5 344.1 17.5 2.5 92.5 (97.6) (58.7) 2,747.6 3,330.3 1,291.3 4,621.6<br />
Net profit for the period 71.3 71.3 144.0 215.3<br />
Total components of the other<br />
comprehensive income 30.1 (21.4) (18.9) (10.1) (22.8) (32.9)<br />
Stock options 12.0 12.0 1.1 13.1<br />
Distribution of profits: Dividends (53.3) (53.3) (71.0) (124.3)<br />
% change in control and consolidation area 0.5 2.3 3.0 (3.5) (0.5)<br />
Balances at December 31, 2009 282.5 344.1 47.6 (18.9) 105.1 (116.5) (58.7) 2,767.9 3,353.1 1,339.1 4,692.2<br />
Net profit for the period 45.8 45.8 151.3 197.1<br />
Total components of the other<br />
comprehensive income 6.4 8.8 139.9 155.1 68.7 223.9<br />
Stock options 3.1 3.1 0.5 3.6<br />
Distribution of profits: Dividends (33.4) (33.4) (96.6) (130.0)<br />
% change in control and consolidation area 0.2 1.2 1.4 (2.2) (0.8)<br />
Balances at December 31, <strong>2010</strong> 282.5 344.1 54.0 (10.1) 108.3 23.5 (58.7) 2,781.5 3,525.1 1,460.9 4,985.9<br />
71<br />
www.italcementigroup.com