Report 2010 - Italcementi Group
Report 2010 - Italcementi Group
Report 2010 - Italcementi Group

You also want an ePaper? Increase the reach of your titles
YUMPU automatically turns print PDFs into web optimized ePapers that Google loves.
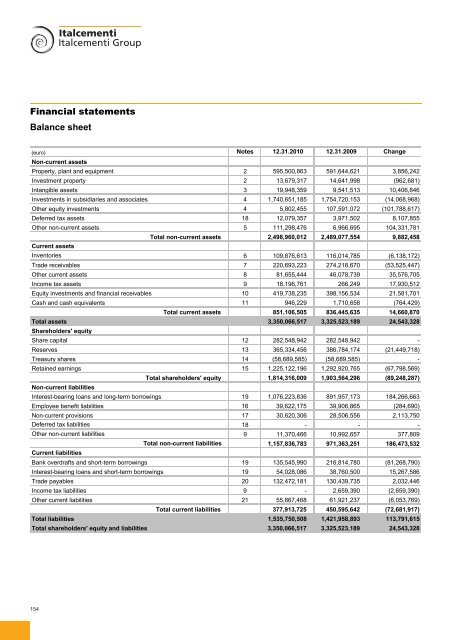
Financial statements<br />
Balance sheet<br />
(euro) Notes 12.31.<strong>2010</strong> 12.31.2009 Change<br />
Non-current assets<br />
Property, plant and equipment 2 595,500,863 591,644,621 3,856,242<br />
Investment property 2 13,679,317 14,641,998 (962,681)<br />
Intangible assets 3 19,948,359 9,541,513 10,406,846<br />
Investments in subsidiaries and associates 4 1,740,651,185 1,754,720,153 (14,068,968)<br />
Other equity investments 4 5,802,455 107,591,072 (101,788,617)<br />
Deferred tax assets 18 12,079,357 3,971,502 8,107,855<br />
Other non-current assets 5 111,298,476 6,966,695 104,331,781<br />
Total non-current assets 2,498,960,012 2,489,077,554 9,882,458<br />
Current assets<br />
Inventories 6 109,876,613 116,014,785 (6,138,172)<br />
Trade receivables 7 220,693,223 274,218,670 (53,525,447)<br />
Other current assets 8 81,655,444 46,078,739 35,576,705<br />
Income tax assets 9 18,196,761 266,249 17,930,512<br />
Equity investments and financial receivables 10 419,738,235 398,156,534 21,581,701<br />
Cash and cash equivalents 11 946,229 1,710,658 (764,429)<br />
Total current assets 851,106,505 836,445,635 14,660,870<br />
Total assets 3,350,066,517 3,325,523,189 24,543,328<br />
Shareholders' equity<br />
Share capital 12 282,548,942 282,548,942 -<br />
Reserves 13 365,334,456 386,784,174 (21,449,718)<br />
Treasury shares 14 (58,689,585) (58,689,585) -<br />
Retained earnings 15 1,225,122,196 1,292,920,765 (67,798,569)<br />
Total shareholders' equity 1,814,316,009 1,903,564,296 (89,248,287)<br />
Non-current liabilities<br />
Interest-bearing loans and long-term borrowings 19 1,076,223,836 891,957,173 184,266,663<br />
Employee benefit liabilities 16 39,622,175 39,906,865 (284,690)<br />
Non-current provisions 17 30,620,306 28,506,556 2,113,750<br />
Deferred tax liabilities 18 - - -<br />
Other non-current liabilities 9 11,370,466 10,992,657 377,809<br />
Total non-current liabilities 1,157,836,783 971,363,251 186,473,532<br />
Current liabilities<br />
Bank overdrafts and short-term borrowings 19 135,545,990 216,814,780 (81,268,790)<br />
Interest-bearing loans and short-term borrowings 19 54,028,086 38,760,500 15,267,586<br />
Trade payables 20 132,472,181 130,439,735 2,032,446<br />
Income tax liabilities 9 - 2,659,390 (2,659,390)<br />
Other current liabilities 21 55,867,468 61,921,237 (6,053,769)<br />
Total current liabilities 377,913,725 450,595,642 (72,681,917)<br />
Total liabilities 1,535,750,508 1,421,958,893 113,791,615<br />
Total shareholders' equity and liabilities 3,350,066,517 3,325,523,189 24,543,328<br />
154