Operating segments The table below sets out segment revenues and results at December 31, <strong>2010</strong>: (in thousands of euro) Revenues Intragroup sales Contributive revenues Recurring EBITDA EBITDA EBIT Finance income (costs) exch.rate differences and derivatives Impairment on financial assets Share of results of associates Profit before tax Income tax expense Italy 689,475 (46,528) 642,947 (36,339) (33,337) (122,626) (1,359) France-Belgium 1,493,788 (13,444) 1,480,344 318,229 316,756 215,547 (250) Spain 176,458 (24,729) 151,729 31,604 31,094 7,657 - Others C.W.E. 70,262 (7,687) 62,575 14,549 14,573 10,176 (1,561) Eliminations (22,643) 22,643 - (12) (42) (43) - C.W.E. 2,407,340 (69,745) 2,337,595 328,031 329,044 110,711 (3,170) North America 415,295 (670) 414,625 25,387 21,717 (48,167) 10,911 Egypt 788,682 (5,764) 782,918 270,665 270,518 191,150 1,162 Morocco 326,066 (1,298) 324,768 125,661 122,422 95,586 8,730 Others EE.NA.ME. 264,430 (3,476) 260,954 18,486 18,879 (9,624) (476) Eliminations (518) 518 - (1) - - - EE.NA.ME. 1,378,660 (10,020) 1,368,640 414,811 411,819 277,112 9,416 Thailand 180,236 (3,635) 176,601 14,958 14,739 (7,306) - India 169,806 - 169,806 36,015 35,903 20,162 - Others Asia 98,926 - 98,926 17,264 17,090 7,171 - Eliminations 1 (1) - - - (1) - Asia 448,969 (3,636) 445,333 68,237 67,732 20,026 - Cement & clinker trading 229,286 (93,056) 136,230 14,304 14,296 11,375 (105) Other operations 424,634 (336,113) 88,521 (14,489) (9,990) (16,966) - Unallocated postings - - - - - - (90,636) (21,014) - 259,155 (62,087) Eliminations (513,240) 513,240 - (19) (340) (338) - Total 4,790,944 - 4,790,944 836,262 834,278 353,753 (90,636) (21,014) 17,052 259,155 (62,087) 92
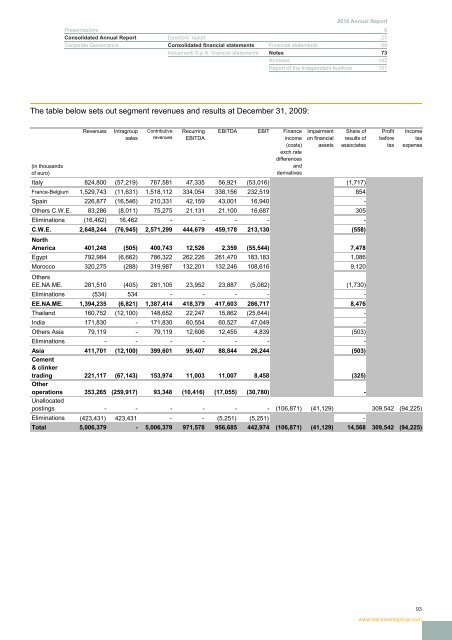
<strong>2010</strong> Annual <strong>Report</strong> Presentazione 6 Consolidated Annual <strong>Report</strong> Directors’ report 27 Corporate Governance Consolidated financial statements Financial statements 68 <strong>Italcementi</strong> S.p.A. financial statements Notes 73 Annexes 142 <strong>Report</strong> of the Independent Auditors 151 The table below sets out segment revenues and results at December 31, 2009: (in thousands of euro) Revenues Intragroup sales Contributive revenues Recurring EBITDA EBITDA EBIT Finance income (costs) exch.rate differences and derivatives Impairment on financial assets Share of results of associates Profit before tax Income tax expense Italy 824,800 (57,219) 767,581 47,335 56,921 (53,016) (1,717) France-Belgium 1,529,743 (11,631) 1,518,112 334,054 338,156 232,519 854 Spain 226,877 (16,546) 210,331 42,159 43,001 16,940 - Others C.W.E. 83,286 (8,011) 75,275 21,131 21,100 16,687 305 Eliminations (16,462) 16,462 - - - - - C.W.E. 2,648,244 (76,945) 2,571,299 444,679 459,178 213,130 (558) North America 401,248 (505) 400,743 12,526 2,359 (55,544) 7,478 Egypt 792,984 (6,662) 786,322 262,226 261,470 183,183 1,086 Morocco 320,275 (288) 319,987 132,201 132,246 108,616 9,120 Others EE.NA.ME. 281,510 (405) 281,105 23,952 23,887 (5,082) (1,730) Eliminations (534) 534 - - - - - EE.NA.ME. 1,394,235 (6,821) 1,387,414 418,379 417,603 286,717 8,476 Thailand 160,752 (12,100) 148,652 22,247 15,862 (25,644) - India 171,830 - 171,830 60,554 60,527 47,049 - Others Asia 79,119 - 79,119 12,606 12,455 4,839 (503) Eliminations - - - - - - - Asia 411,701 (12,100) 399,601 95,407 88,844 26,244 (503) Cement & clinker trading 221,117 (67,143) 153,974 11,003 11,007 8,458 (325) Other operations 353,265 (259,917) 93,348 (10,416) (17,055) (30,780) - Unallocated postings - - - - - - (106,871) (41,129) 309,542 (94,225) Eliminations (423,431) 423,431 - - (5,251) (5,251) - Total 5,006,379 - 5,006,379 971,578 956,685 442,974 (106,871) (41,129) 14,568 309,542 (94,225) 93 www.italcementigroup.com
- Page 1 and 2:
2010 Annual Report
- Page 3 and 4:
2010 Annual Report Italcementi S.p.
- Page 5 and 6:
In the past three financial years w
- Page 7 and 8:
2010 Annual Report Presentation Gen
- Page 9 and 10:
2010 Annual Report Presentation Gen
- Page 11 and 12:
2010 Annual Report Presentation Gen
- Page 13 and 14:
2010 Annual Report Presentation Gen
- Page 15 and 16:
2010 Annual Report Presentation Gen
- Page 17 and 18:
2010 Annual Report Presentation Gen
- Page 19 and 20:
2010 Annual Report Presentation Gen
- Page 21 and 22:
2010 Annual Report Presentation Gen
- Page 23 and 24:
2010 Annual Report Presentation Gen
- Page 25:
2010 Annual Report Presentation Gen
- Page 28 and 29:
Directors’ report Following the a
- Page 30 and 31:
Significant events for the year Sig
- Page 32 and 33:
Business and financial performance
- Page 34 and 35:
Fourth-quarter sales volumes and in
- Page 36 and 37:
Revenues and operating results Cont
- Page 38 and 39:
Total comprehensive income In 2010,
- Page 40 and 41:
Net debt breakdown (in millions of
- Page 42 and 43: 2010 to the Internal Control Commit
- Page 44 and 45: Conformity risks The Group is subje
- Page 46 and 47: constraints imposed by the stringen
- Page 48 and 49: The construction sector reported a
- Page 50 and 51: ASIA Thailand India Others (1) Tota
- Page 52 and 53: The reduction arose essentially as
- Page 54 and 55: Turkey Work continued in 2010 to ob
- Page 56 and 57: variable amount. The fixed amount i
- Page 58 and 59: Information systems The three-year
- Page 60 and 61: Raw materials and alternative fuels
- Page 62 and 63: Engineering, technical assistance,
- Page 64 and 65: serves public companies and institu
- Page 66 and 67: Set Group Holding represents a sign
- Page 68 and 69: Financial statements Balance sheet
- Page 70 and 71: Statement of comprehensive income (
- Page 72 and 73: Consolidated cash flow statement No
- Page 74 and 75: 21. Deferred tax 22. Net debt 23. O
- Page 76 and 77: no longer generate goodwill, nor ga
- Page 78 and 79: Subsidiaries Subsidiaries are compa
- Page 80 and 81: 1.5. Translation of foreign currenc
- Page 82 and 83: 1.10. Intangible assets Intangible
- Page 84 and 85: deferred tax assets are reviewed at
- Page 86 and 87: Pending publication of a standard/i
- Page 88 and 89: 2. Exchange rates used to translate
- Page 90 and 91: 4. Operating segment disclosure The
- Page 94 and 95: The table below sets out other segm
- Page 96 and 97: Assets 5 Property, plant and equipm
- Page 98 and 99: 6.2 Goodwill testing Goodwill acqui
- Page 100 and 101: “Concessions” are amortized ove
- Page 102 and 103: 9. Other equity investments This no
- Page 104 and 105: 12. Trade receivables (in thousands
- Page 106 and 107: 17. Dividends paid Dividends declar
- Page 108 and 109: The movements in defined benefit li
- Page 110 and 111: 20. Provisions Non-current and curr
- Page 112 and 113: 22.1 Loans and borrowings Loans and
- Page 114 and 115: ) in the third quarter of 2010, Ita
- Page 116 and 117: v) in the third quarter of 2010, Ci
- Page 118 and 119: Fair value - hierarchy In determini
- Page 120 and 121: In 2009 and 2010, in view of the su
- Page 122 and 123: 22.4 Interest-rate risk Notional va
- Page 124 and 125: 22.6 Exposure to exchange-rate risk
- Page 126 and 127: 22.8 Hedge Accounting The effects a
- Page 128 and 129: At December 31, 2010, the average m
- Page 130 and 131: 25. Goods and utilities expenses Go
- Page 132 and 133: The following table sets out the de
- Page 134 and 135: The reconciliation between the theo
- Page 136 and 137: 34. Transactions with related parti
- Page 138 and 139: 36. Cash flow statement 36.1. Cash
- Page 140 and 141: 38. Considerations to the Independe
- Page 142 and 143:
Annex 1 The following table has bee
- Page 144 and 145:
Company Registered office Share cap
- Page 146 and 147:
Company Registered office Share cap
- Page 148 and 149:
Company Registered office Share cap
- Page 150:
Representation form pursuant to art
- Page 154 and 155:
Financial statements Balance sheet
- Page 156 and 157:
Statement of comprehensive income (
- Page 158 and 159:
Cash flow statement 2010 2009 (euro
- Page 160 and 161:
Transactions with related parties o
- Page 164 and 165:
Summary of resolutions The Annual G
- Page 166 and 167:
Extraordinary session: 1) to amend
- Page 168 and 169:
Report on Corporate Governance and
- Page 170 and 171:
c) Significant shareholders as disc
- Page 172 and 173:
In the event of presentation of mor
- Page 174 and 175:
By resolution of June 20 th , 2007,
- Page 176 and 177:
d) Analysis of controls at process
- Page 178 and 179:
8) the various company functions, w
- Page 180 and 181:
knowledge of the company and its dy
- Page 182 and 183:
Emilio Zanetti * Unione di Banche I
- Page 184 and 185:
at their request, the Chief Executi
- Page 186 and 187:
The lists must be presented at the
- Page 188 and 189:
- for the simultaneous replacement
- Page 190 and 191:
Within the Board of Directors, the
- Page 192 and 193:
their level of agreement has been m
- Page 194 and 195:
The Board of Directors, with the as
- Page 196 and 197:
TABLE 2 BOARD OF STATUTORY AUDITORS
- Page 198 and 199:
Code of ethics The Code, approved f
- Page 200 and 201:
only if the unrelated shareholders
- Page 202 and 203:
EQUITY INVESTMENTS OF DIRECTORS, ST
- Page 204 and 205:
parent company, on a regular basis,
- Page 206 and 207:
Stock option plan for directors - 2
- Page 208 and 209:
Based on the opinion of the Committ
- Page 210 and 211:
g) Share capital increase; disposal
- Page 212 and 213:
Italcementi S.p.A. will have a pre-
- Page 214 and 215:
iii) approving for each assignee th
- Page 216 and 217:
216
- Page 218 and 219:
Annex 1 Highlights from the most re
- Page 220 and 221:
(in thousands of euro) Full name Po
- Page 222 and 223:
STOCK OPTIONS GRANTED TO DIRECTORS
- Page 224 and 225:
CIMENTS FRANÇAIS S.A. Options held
- Page 226 and 227:
Corporate bodies resulting from the
- Page 228:
italcementi S.p.A. Via G. Camozzi,