- Page 1 and 2: 2010 Annual Report
- Page 3 and 4: 2010 Annual Report Italcementi S.p.
- Page 5 and 6: In the past three financial years w
- Page 7 and 8: 2010 Annual Report Presentation Gen
- Page 9 and 10: 2010 Annual Report Presentation Gen
- Page 11 and 12: 2010 Annual Report Presentation Gen
- Page 13 and 14: 2010 Annual Report Presentation Gen
- Page 15 and 16: 2010 Annual Report Presentation Gen
- Page 17 and 18: 2010 Annual Report Presentation Gen
- Page 19 and 20: 2010 Annual Report Presentation Gen
- Page 21 and 22: 2010 Annual Report Presentation Gen
- Page 23 and 24: 2010 Annual Report Presentation Gen
- Page 25: 2010 Annual Report Presentation Gen
- Page 28 and 29: Directors’ report Following the a
- Page 30 and 31: Significant events for the year Sig
- Page 34 and 35: Fourth-quarter sales volumes and in
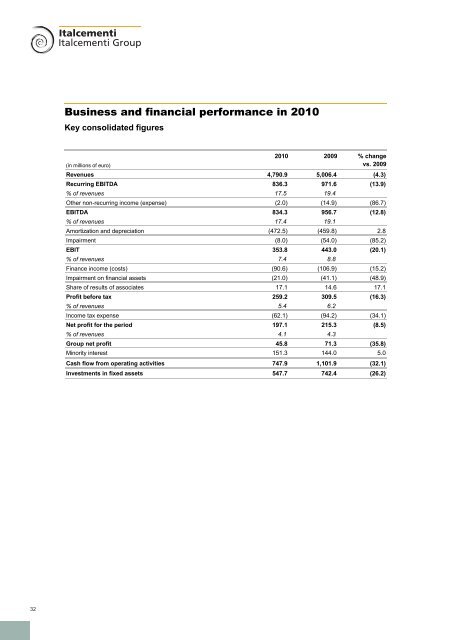
- Page 36 and 37: Revenues and operating results Cont
- Page 38 and 39: Total comprehensive income In 2010,
- Page 40 and 41: Net debt breakdown (in millions of
- Page 42 and 43: 2010 to the Internal Control Commit
- Page 44 and 45: Conformity risks The Group is subje
- Page 46 and 47: constraints imposed by the stringen
- Page 48 and 49: The construction sector reported a
- Page 50 and 51: ASIA Thailand India Others (1) Tota
- Page 52 and 53: The reduction arose essentially as
- Page 54 and 55: Turkey Work continued in 2010 to ob
- Page 56 and 57: variable amount. The fixed amount i
- Page 58 and 59: Information systems The three-year
- Page 60 and 61: Raw materials and alternative fuels
- Page 62 and 63: Engineering, technical assistance,
- Page 64 and 65: serves public companies and institu
- Page 66 and 67: Set Group Holding represents a sign
- Page 68 and 69: Financial statements Balance sheet
- Page 70 and 71: Statement of comprehensive income (
- Page 72 and 73: Consolidated cash flow statement No
- Page 74 and 75: 21. Deferred tax 22. Net debt 23. O
- Page 76 and 77: no longer generate goodwill, nor ga
- Page 78 and 79: Subsidiaries Subsidiaries are compa
- Page 80 and 81: 1.5. Translation of foreign currenc
- Page 82 and 83:
1.10. Intangible assets Intangible
- Page 84 and 85:
deferred tax assets are reviewed at
- Page 86 and 87:
Pending publication of a standard/i
- Page 88 and 89:
2. Exchange rates used to translate
- Page 90 and 91:
4. Operating segment disclosure The
- Page 92 and 93:
Operating segments The table below
- Page 94 and 95:
The table below sets out other segm
- Page 96 and 97:
Assets 5 Property, plant and equipm
- Page 98 and 99:
6.2 Goodwill testing Goodwill acqui
- Page 100 and 101:
“Concessions” are amortized ove
- Page 102 and 103:
9. Other equity investments This no
- Page 104 and 105:
12. Trade receivables (in thousands
- Page 106 and 107:
17. Dividends paid Dividends declar
- Page 108 and 109:
The movements in defined benefit li
- Page 110 and 111:
20. Provisions Non-current and curr
- Page 112 and 113:
22.1 Loans and borrowings Loans and
- Page 114 and 115:
) in the third quarter of 2010, Ita
- Page 116 and 117:
v) in the third quarter of 2010, Ci
- Page 118 and 119:
Fair value - hierarchy In determini
- Page 120 and 121:
In 2009 and 2010, in view of the su
- Page 122 and 123:
22.4 Interest-rate risk Notional va
- Page 124 and 125:
22.6 Exposure to exchange-rate risk
- Page 126 and 127:
22.8 Hedge Accounting The effects a
- Page 128 and 129:
At December 31, 2010, the average m
- Page 130 and 131:
25. Goods and utilities expenses Go
- Page 132 and 133:
The following table sets out the de
- Page 134 and 135:
The reconciliation between the theo
- Page 136 and 137:
34. Transactions with related parti
- Page 138 and 139:
36. Cash flow statement 36.1. Cash
- Page 140 and 141:
38. Considerations to the Independe
- Page 142 and 143:
Annex 1 The following table has bee
- Page 144 and 145:
Company Registered office Share cap
- Page 146 and 147:
Company Registered office Share cap
- Page 148 and 149:
Company Registered office Share cap
- Page 150:
Representation form pursuant to art
- Page 154 and 155:
Financial statements Balance sheet
- Page 156 and 157:
Statement of comprehensive income (
- Page 158 and 159:
Cash flow statement 2010 2009 (euro
- Page 160 and 161:
Transactions with related parties o
- Page 164 and 165:
Summary of resolutions The Annual G
- Page 166 and 167:
Extraordinary session: 1) to amend
- Page 168 and 169:
Report on Corporate Governance and
- Page 170 and 171:
c) Significant shareholders as disc
- Page 172 and 173:
In the event of presentation of mor
- Page 174 and 175:
By resolution of June 20 th , 2007,
- Page 176 and 177:
d) Analysis of controls at process
- Page 178 and 179:
8) the various company functions, w
- Page 180 and 181:
knowledge of the company and its dy
- Page 182 and 183:
Emilio Zanetti * Unione di Banche I
- Page 184 and 185:
at their request, the Chief Executi
- Page 186 and 187:
The lists must be presented at the
- Page 188 and 189:
- for the simultaneous replacement
- Page 190 and 191:
Within the Board of Directors, the
- Page 192 and 193:
their level of agreement has been m
- Page 194 and 195:
The Board of Directors, with the as
- Page 196 and 197:
TABLE 2 BOARD OF STATUTORY AUDITORS
- Page 198 and 199:
Code of ethics The Code, approved f
- Page 200 and 201:
only if the unrelated shareholders
- Page 202 and 203:
EQUITY INVESTMENTS OF DIRECTORS, ST
- Page 204 and 205:
parent company, on a regular basis,
- Page 206 and 207:
Stock option plan for directors - 2
- Page 208 and 209:
Based on the opinion of the Committ
- Page 210 and 211:
g) Share capital increase; disposal
- Page 212 and 213:
Italcementi S.p.A. will have a pre-
- Page 214 and 215:
iii) approving for each assignee th
- Page 216 and 217:
216
- Page 218 and 219:
Annex 1 Highlights from the most re
- Page 220 and 221:
(in thousands of euro) Full name Po
- Page 222 and 223:
STOCK OPTIONS GRANTED TO DIRECTORS
- Page 224 and 225:
CIMENTS FRANÇAIS S.A. Options held
- Page 226 and 227:
Corporate bodies resulting from the
- Page 228:
italcementi S.p.A. Via G. Camozzi,


